Last update: Jan 28, 2026·3 minutes read

Cart Abandonment Statistics [2026 Update] – Why Shoppers Leave

Cart abandonment costs retailers $18 billion each year. Discover why 70% of carts get abandoned, why mobile shoppers drop off even more (85.2%), and how clear return policies can slash abandonment by 28%.

Manisha Saini
Written by Manisha Saini , Data-Driven Marketing Expert
Leszek Dudkiewicz
Reviewed by Leszek Dudkiewicz , Digital Growth Manager
Cart Abandonment Statistics [2026 Update] – Why Shoppers Leave
As seen on:
Table of Contents
    Share:

    Every marketer knows this moment: a user browses, selects, clicks “Add to Cart”—then disappears. Cart abandonment isn’t just a UX hiccup. It’s a revenue leak. And in 2026, it’s still one of the biggest challenges for e-commerce brands across the globe.

    In this report, we break down the latest cart abandonment stats, uncover what’s driving shoppers to bail, and share data-backed ways brands are winning them back.

    Key cart abandonment stats

    1. 70% of online shopping carts are abandoned on average.
    2. On mobile, abandonment is even higher85.2%.
    3. 48% of shoppers drop off due to unexpected costs at checkout.
    4. Slow websites increase abandonment by 75%.
    5. The trust badges and clear return policies can reduce abandonment by up to 28%.
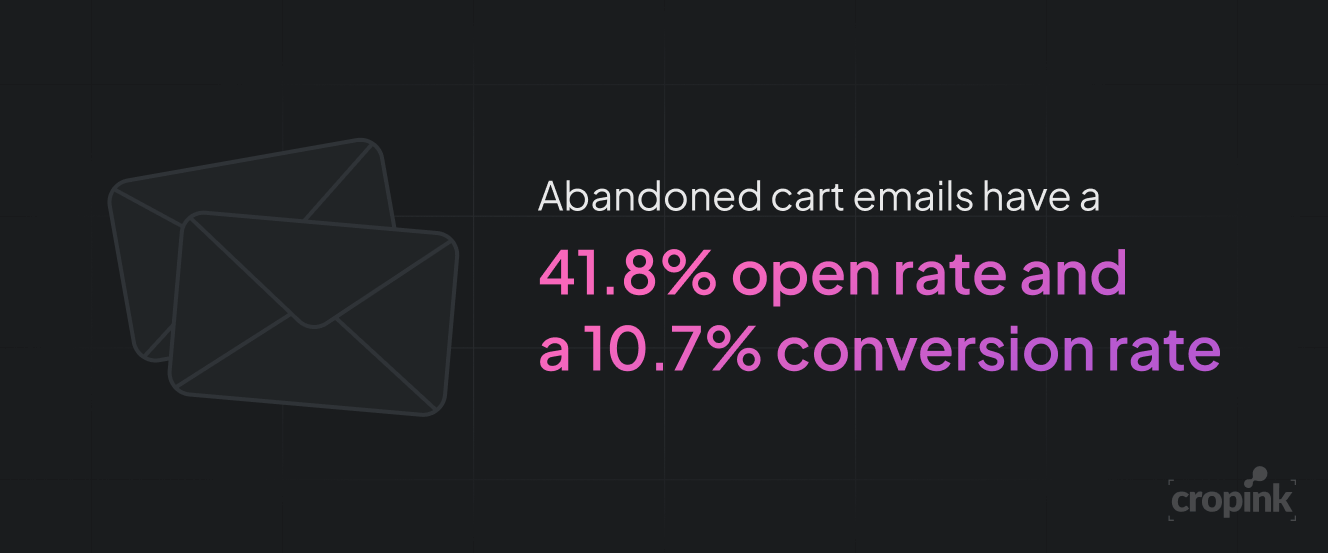
    6. Abandoned cart emails have a 41.8% open rate and a 10.7% conversion rate.
    7. Retailers lose roughly $18 billion annually to cart abandonment.
    8. 43% of users who abandon carts say they were "just browsing."

    cart-abandnment-stats.png

    Turn product images into catalog ads. Automatically!

    Why shoppers still abandon carts

    Cart abandonment isn’t just about pricing, it’s about experience. 

    Here's what the latest data says about why shoppers click away:

    1. Unexpected costs still top the list

    Extra charges at checkout (like shipping, taxes, or handling fees) cause 48% of cart abandonments. People don’t like surprises, especially when it comes to price.

    2. Mobile friction is real

    With mobile shopping rising, clunky forms and slow pages remain major turnoffs. Mobile cart abandonment now hits 85.2%, according to 2025 trends.

    3. No guest checkout? Big mistake

    26% of users leave because sites force account creation. Shoppers want speed, not forms.

    4. Payment hiccups

    Lack of payment options (like digital wallets, BNPL, or local methods) causes frustration. 13% of shoppers abandon carts due to limited payment methods.

    5. Site performance = Conversion performance

    A 1-second delay in page load can reduce conversions by 7%. If your checkout drags, so do your numbers.

    Cart abandonment by industry

    In 2025, it's estimated that e-commerce retailers lose approximately $18 billion annually due to abandoned carts. 

    Here we have prepared a list of industries with their cart abandonment rates:

    IndustryAverage Cart Abandonment Rate
    Fashion & Apparel84.4%
    Electronics71.8%
    Travel & Hospitality87.1%
    Retail68.1%
    Automotive75.4%
    Grocery & Essentials62.3%
    Luxury & Jewelry81.4%
    Pet Care & Veterinary56.1%

    average-cart-abandonment-rate-by-industry.png

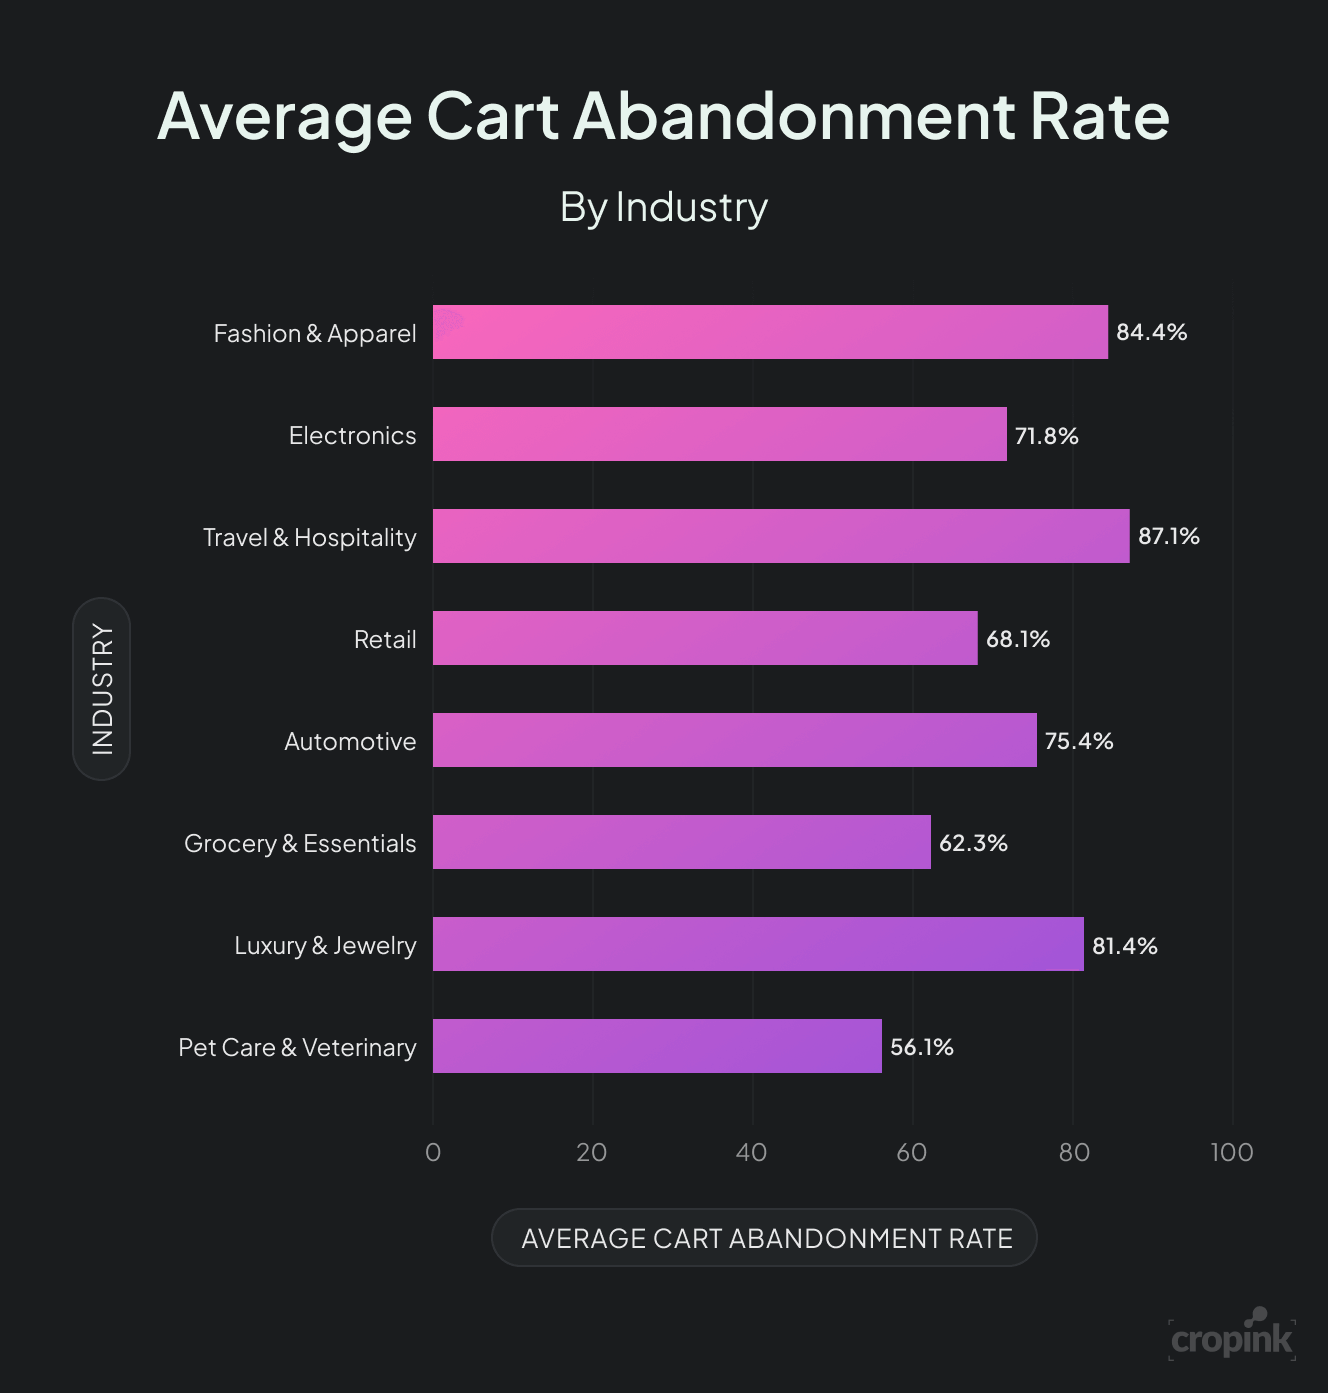
    The numbers vary by vertical, but one thing’s clear: no industry is immune.

    How brands are reducing cart abandonment

    1. Offering upfront pricing

    Retailers now display shipping and taxes earlier in the funnel. This small change alone reduces abandonment by 15%.

    1. Simplifying checkout flows

    Sites that use one-page checkouts or express payment options (Apple Pay, Shop Pay) see higher conversion rates, up to 21% better than standard checkouts.

    1. Using cart recovery emails

    Triggered cart abandonment emails are still effective. When timed right, they bring back 1 in 10 lost users.

    1. Leveraging exit-intent popups

    Offering a discount or free shipping when users are about to exit has proven to significantly reduce bounce rates, especially on mobile devices.

    1. Personalizing reminders

    Brands that tailor cart reminder emails with product photos, prices, and urgency messaging see 30–40% more clicks.

    Tools that help fix cart abandonment

    If you want to reduce cart abandonment, automation helps. 

    Below are a few tools many brands use:

    • Klaviyo. For smart abandoned cart emails and SMS
    • OptiMonk. For exit-intent popups and personalized offers
    • Shopify Flow. For automating reminders and upsells
    • Hotjar. To analyze checkout drop-offs via session replays
    • Cropink. To run retargeting ads across Meta and Google for abandoned carts

    Create Catalog Ads with Your Product Data

    No cards. No trial. No hidden fees. It’s that simple.

    Final thoughts

    Cart abandonment isn’t going away, but it’s fixable. In 2025, brands that win are the ones that think beyond coupons and retargeting. They create checkout experiences that feel fast, safe, and frictionless.

    If you're not optimizing your checkout flow or recovery strategy, you're leaving revenue on the table daily.

    FAQs

    What is the average cart abandonment rate?

    Roughly 70%, though it can be much higher on mobile and in travel or luxury categories.

    What is the top reason for cart abandonment?

    Unexpected extra costs at checkout, such as shipping or taxes.

    What is a good cart recovery email open rate?

    About 41–43% is the average open rate, with 10–11% conversion.

    Do retargeting ads help reduce abandonment?

    Yes. When paired with email and SMS, they significantly increase the chance of recovery.

    Manisha Saini
    Written by Manisha SainiData-Driven Marketing Expert

    Manisha is a Data-Driven Marketing Expert who turns numbers into narratives and ad clicks into conversions. With a passion for performance marketing and a sharp eye for analytics, she helps brands cut through the noise and maximize their impact in the digital space.

    Follow me:LinkedIn
    Leszek Dudkiewicz
    Reviewed by Leszek DudkiewiczDigital Growth Manager

    Leszek is the Digital Growth Manager at Feedink & Cropink, specializing in organic growth for eCommerce and SaaS companies. His background includes roles at Poland's largest accommodation portal and FT1000 companies, with his work featured in Forbes, Inc., Business Insider, Fast Company, Entrepreneur, BBC, and TechRepublic.

    Follow me:LinkedIn
    What is Cropink?

    Cropink is an app that turns raw product feed into appealing Facebook ads enriched with product data. It helps to drive engaging campaigns without creative limitations and keeps everything in sync.

    Beautify your product catalog in minutes

    No credit card required

    What is Cropink?

    Cropink is an app that turns raw product feed into appealing Facebook ads enriched with product data. It helps to drive engaging campaigns without creative limitations and keeps everything in sync.

    Beautify your product catalog in minutes

    No credit card required

    Related Articles

    Statistics·Last update: Jan 29, 2026
    50+ Black Friday Statistics & Trends To Look For [2026]

    Black Friday remains a retail powerhouse, driving billions in sales and shaping shopping trends. From mobile dominance to the best discounts, explore the key stats behind this global shopping event!

    Manisha Saini
    Written by Manisha Saini , Data-Driven Marketing Expert
    Statistics·Last update: Jan 26, 2026
    40+ X (Twitter) Statistics You Need To Know [2026]

    X (Twitter) has 600M active users, with 7.8B minutes spent daily—yet only 10% create 92% of tweets. Discover 2026’s top stats, from ad trends to why X Premium users stay 3x longer. Perfect for marketers looking to stay ahead.

    Maja Celmer
    Written by Maja Celmer , Content Writer with Digital Marketing Expertise
    Statistics·Last update: Jan 22, 2026
    45+ Online Business Statistics & Trends [2026]

    Online business is booming—nearly 30% of all businesses are now online, with eCommerce sales set to surpass $4.3 trillion in 2025. Discover 45+ powerful stats on consumer behavior, social commerce, and the trends fueling digital growth this year.

    Benard Kiplangat
    Written by Benard Kiplangat , Data-Driven Content Marketer
    Statistics·Last update: Jan 22, 2026
    50+ Key Reddit Statistics You Must Know in 2026

    In 2026, Reddit draws 1.1B monthly users and 3.31B U.S. visits in January alone. With $1.3B in annual revenue, it's a global hub for niche communities, humor, and high-income users alike.

    Manisha Saini
    Written by Manisha Saini , Data-Driven Marketing Expert
    Statistics·Last update: Jan 22, 2026
    Chrome Statistics: Latest Trends & Market Dominance [2026]

    Is Chrome still king in 2026? With 64.86% global market share and 3.45B+ users, Chrome dominates—but rising AI rivals, privacy concerns, and regional shifts raise questions. Dive into key stats, trends, and updates shaping Chrome’s future.

    Ansherina Opena
    Written by Ansherina Opena , Digital Marketing Expert
    Statistics·Last update: Jan 22, 2026
    50+ Digital Transformation Statistics: Growth, Spending & Trends to Know

    Is digital transformation just hype? Think again. With 81% of leaders calling it critical and the market set to triple by 2030, DX is reshaping business fast. Discover why most fail, who succeeds, and how your company can lead the charge.

    Damaris Hinga
    Written by Damaris Hinga , Digital Marketing Specialist
    Statistics·Last update: Jan 21, 2026
    30+ Sales Funnel Statistics with Insights to Boost Conversions [2026]

    Want to optimize your sales funnel? Explore the latest statistics on conversion rates, drop-off points, and buyer behavior to drive better results.

    Manisha Saini
    Written by Manisha Saini , Data-Driven Marketing Expert
    Statistics·Last update: Jan 21, 2026
    55+ Customer Experience Statistics You Can’t Afford to Ignore in [2026]

    Companies globally lose $3.7 trillion every year because of poor customer experiences. Find out why it happens, what mistakes drive customers away, and how exceptional CX can boost your revenue.

    Damaris Hinga
    Written by Damaris Hinga , Digital Marketing Specialist
    Statistics·Last update: Jan 21, 2026
    97+ Conversion Rate Optimization Statistics [With Trends & Insights for 2026]

    Most businesses spend $92 to acquire a customer but only $1 to convert them. Discover 97+ CRO stats, like how 40+ landing pages can boost conversions by 500%, and why video and AI personalization are game-changers for turning visits into revenue.

    Benard Kiplangat
    Written by Benard Kiplangat , Data-Driven Content Marketer
    Statistics·Last update: Jan 21, 2026
    30+ Brand Loyalty Statistics: What Keeps Customers Coming Back in [2026]

    Did you know 65% of a company’s business comes from existing customers—and loyal ones spend up to 18% more? Discover why 75% of consumers prefer brands with rewards and how emotional connections can boost lifetime value by 306%.

    Manisha Saini
    Written by Manisha Saini , Data-Driven Marketing Expert
    Statistics·Last update: Jan 20, 2026
    30+ DeepSeek Statistics: How This AI Model is Changing the Game [2026]

    DeepSeek is gaining momentum fast, with 22.15 million daily users and rapid enterprise adoption. How does it compare to GPT-4? What are its strengths and challenges? Here’s a breakdown of its impact.

    Manisha Saini
    Written by Manisha Saini , Data-Driven Marketing Expert
    Statistics·Last update: Jan 20, 2026
    Apple Pay Statistics [2026]: Usage Trends and Market Growth

    Apple Pay has come a long way since its 2014 launch, now boasting 785 million users worldwide. With 85% of U.S. retailers accepting it and Gen Z leading adoption, its growth shows no signs of slowing.

    Damaris Hinga
    Written by Damaris Hinga , Digital Marketing Specialist

    Start with Cropink is easy and free

    No credit card required