Facebook Ad Metrics: The Key to Higher ROI & Smarter Ad Spend
Facebook generated $164.5B in ad revenue with an average $1.72 CPC and 9.21% conversion rate. Fitness reaches 14.29% CVR while apparel averages 1.24% CTR. Track CTR, CPC, CPM, ROAS and frequency to control spend, reduce ad fatigue and increase measurable ROI.


Did you know that Facebook generated over $164.5 billion in ad revenue in 2024, up from $134 billion the previous year? That’s because businesses across the globe continue to pour money into Facebook ads.
But here’s the real question: Are your Facebook ads actually working for you?
Many businesses focus on vanity metrics—likes, shares, and comments—without tracking the real indicators of success. That’s where Facebook ad metrics come in. By analyzing the right data, you can tweak your campaigns, optimize your budget, and increase conversions.
So, let’s break down the key Facebook ad metrics you need to know, in a way that’s easy (and even fun) to understand!
Key takeaways
- Tracking the right metrics is key to Facebook ad success. Focus on CTR, CPC, and ROAS to measure performance effectively.
- Optimizing for conversions matters just as much as clicks. A high CTR is great, but if clicks don’t lead to sales, your strategy needs tweaking.
- Avoiding ad fatigue keeps engagement high. Monitoring frequency helps prevent overexposure and ad burnout.
- Constant testing and refinement boost ROI. A/B testing creatives, targeting, and placements help find the best approach.
1. Impressions- How often does your ad show up?
Imagine putting up a billboard on a busy highway. Every time a car passes by and a driver sees your ad, that’s an impression. On Facebook, impressions measure the total number of times your ad is displayed on users’ screens—whether they engage with it or not.
Why do impressions matter? Because the more people see your ad, the more familiar they become with your brand. It brings in another factor- ‘ad saturation’- a high number of impressions with low engagement, which means your audience may be seeing your ad too often without interacting.
And you can’t ignore the cost efficiency. Facebook ads operate on an auction system. More impressions for the same budget means your ads are cost-efficient.

If your impressions are rising, but engagement isn’t, consider tweaking your visuals, ad copy, or audience targeting.
2. Reach- Are you getting seen by enough people?
Think of reach as the number of unique individuals who have seen your ad at least once. Unlike impressions, which count total views (including repeats), reach only counts the number of distinct users.
Here’s the thing–the higher the reach, the more the brand exposure. Do you know what lower reach signifies? It’s a performance indicator that means poor targeting or a weak bidding strategy.
But if your reach is low but impressions are high, the same people are seeing your ad multiple times, which often leads to ad fatigue.
If your reach is lower than expected, try using Lookalike Audiences to tap into fresh, high-intent users. Facebook takes your best customers, finds people who mirror their interests and behaviors, and helps you reach new audiences that are more likely to convert—without trial and error.
3. CTR (Click-Through Rate)- Are people clicking or just scrolling?
CTR is one of the most critical Facebook ad metrics. A low CTR is bad news! It tells you what percentage of people clicked on your ad after seeing it. A high CTR means your ad is engaging and relevant, while a low CTR suggests your message isn’t resonating with your audience.
Let’s bring in more clarity here. Higher CTR = Lower Costs. Facebook rewards engaging ads by lowering your cost per click (CPC). A low CTR might indicate that your targeting is off—you may be reaching people who aren’t interested.
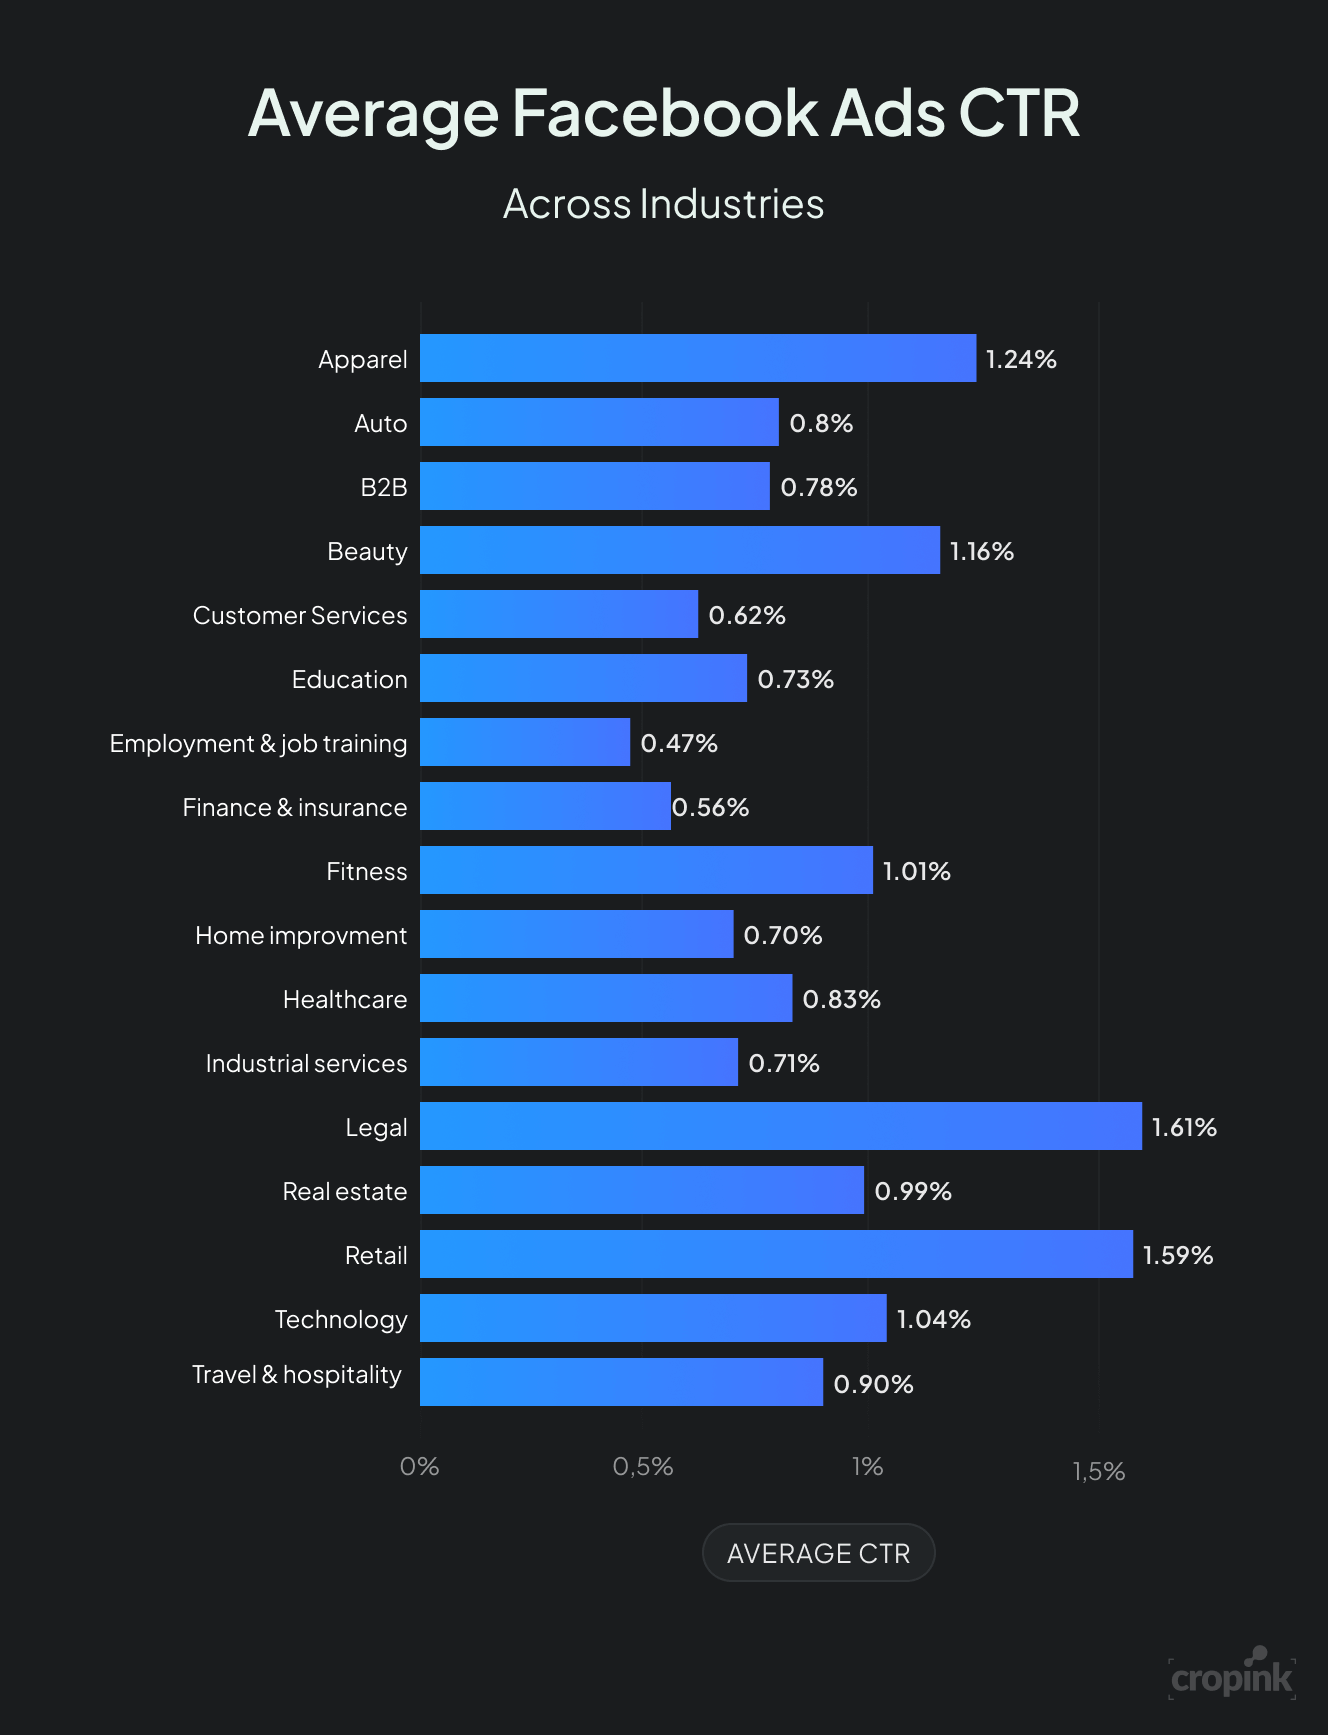
Apparel industry has the highest number (1.24%) of CTR. Auto and B2B industries ads bring in good CTR too, with an average percentage of 1.80% and 0.78% respectively.
Below we have curated a table of Facebook ads CTR in all major industries:
| Industry | Average CTR |
|---|---|
| Apparel | 1.24% |
| Auto | 0.80% |
| B2B | 0.78% |
| Beauty | 1.16% |
| Consumer Services | 0.62% |
| Education | 0.73% |
| Employment & Job Training | 0.47% |
| Finance & Insurance | 0.56% |
| Fitness | 1.01% |
| Home Improvement | 0.70% |
| Healthcare | 0.83% |
| Industrial Services | 0.71% |
| Legal | 1.61% |
| Real Estate | 0.99% |
| Retail | 1.59% |
| Technology | 1.04% |
| Travel & Hospitality | 0.90% |
CTR also reflects how compelling your visuals and copy are. Try testing different ad formats (carousel, video, single image) and CTAs (like “Sign Up” vs. “Learn More”) to see what boosts your CTR.
4. CPC (Cost Per Click)- Is your ad budget working for you?
CPC tells you how much you are paying each time someone clicks your ad. This metric directly affects your overall advertising budget and ROI.
According to the latest data, the average CPC for Facebook ads is $1.72 across all industries. Let’s take a look at how top industries performing in detail:
| Industry | Average CPC |
|---|---|
| Apparel | $0.45 |
| Auto | $2.24 |
| B2B | $2.52 |
| Beauty | $1.81 |
| Consumer Services | $3 .08 |
| Education | $1.06 |
| Employment & Job Training | $2.72 |
| Finance & Insurance | $3.77 |
| Fitness | $1.90 |
| Home Improvement | $2.93 |
| Healthcare | $1.32 |
| Industrial Services | $2.14 |
| Legal | $1.32 |
| Real Estate | $1.81 |
| Retail | $0.70 |
| Technology | $1.27 |
| Travel & Hospitality | $0.63 |
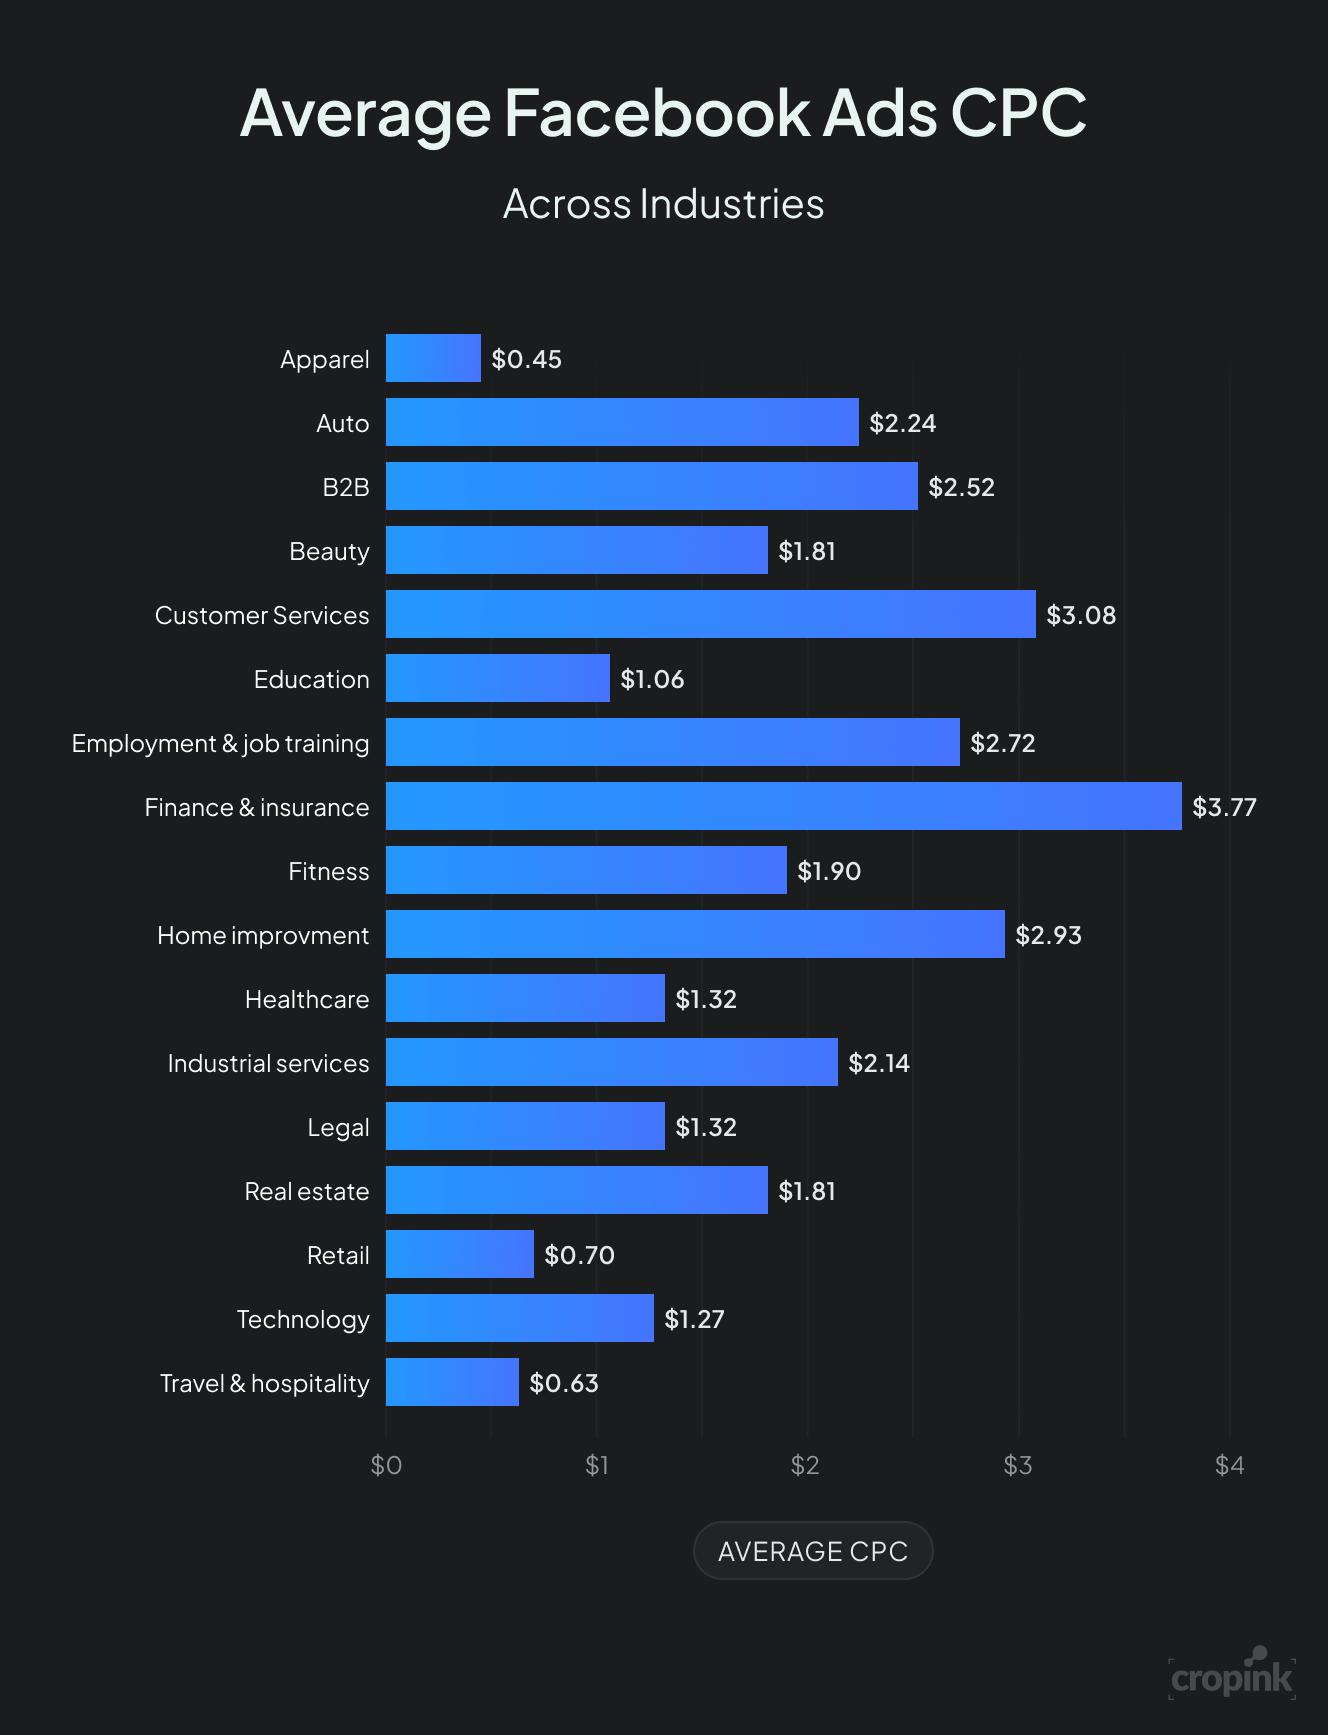
A high CPC means you’re spending more per visitor, which can reduce profitability. Industries with intense competition, such as finance & insurance ($3.77 per click) and B2B ($2.52 per click), often experience higher CPCs. Meanwhile, the cheapest clicks come from apparel ($0.45), travel & hospitality ($0.63), and retail ($0.70)—industries with broader audiences and higher ad volume.
If you are trying to reduce CPC, simply narrow down your audience and optimize ad creatives for more engagement.
5. CPM (Cost Per Thousand Impressions)- The price of visibility
CPM tells you how much you’re paying per 1,000 views of your ad. This is particularly important if your goal is brand awareness rather than direct conversions.
It is a solid brand awareness indicator. Lower CPM means you’re reaching more people for less money. A high CPM can indicate that Facebook doesn’t find your ad relevant to your target audience.
But there’s a catch, your CPM can be higher in industries with fierce competition. However, if your CPM is too high, try adjusting your bidding strategy or targeting broader audiences.
6. Conversion Rate- Are clicks turning into sales?
This is the most important question- are clicks turning into sales? A high CTR is great, but if users aren’t converting, it’s like having people walk into your store and leave without buying anything.
Conversion rate (CVR) measures the percentage of users who take a desired action (buying a product, signing up, downloading an app, etc.) after clicking your ad. Higher conversions mean a better return on ad spend.
The average conversion rate (CVR) for Facebook ads across all industries is 9.21%, but some industries perform significantly better than others. Fitness advertisers see the highest conversion rates at 14.29%, followed by education (13.58%), employment & job training (11.73%), healthcare (11.00%), and real estate (10.68%).
However, industries like retail (3.26%), travel & hospitality (2.82%), and technology (2.31%) often struggle with lower conversion rates.
| Industry | Average CVR |
|---|---|
| Apparel | 4.11% |
| Auto | 5.11% |
| B2B | 10.63% |
| Beauty | 7.10% |
| Consumer Services | 9.96% |
| Education | 13.58% |
| Employment & Job Training | 11.73% |
| Finance & Insurance | 9.09% |
| Fitness | 14.29% |
| Home Improvement | 6.56% |
| Healthcare | 11.00% |
| Industrial Services | 0.71% |
| Legal | 5.60% |
| Real Estate | 10.68% |
| Retail | 3.26% |
| Technology | 2.31% |
| Travel & Hospitality | 2.82% |

Are you stuck with high CTR but low conversions? Your landing page might be the problem. Simply making it simple, fast, and distraction-free might help you. Or learn in depth about where users drop off, it will help you refine your sales funnel.
You can learn How to Create Good Facebook Ads: A Step-by-Step Guide here.
7. ROAS (Return on Ad Spend)- The ultimate success metric
ROAS is the golden metric that tells you whether your Facebook ads are profitable or not. It measures how much revenue you generate for every dollar spent on ads.
A low ROAS means you’re spending more than you are earning and a strong ROAS justifies increasing your ad spend.
Compare your ROAS across different campaigns to see which ones deliver the best returns. A good ROAS is typically 2.5x to 4x.
8. Engagement Metrics: Are people reacting to your ads?
Did you notice how many people liked, shared, and commented on your ad? While these don’t directly lead to conversions, they indicate how much people care about your content.
The engagement on your ad posts is good then it serves as social proof and builds trust among consumers. It makes your ad more appealing to new viewers.
Facebook rewards engaging ads by showing them more often at a lower cost. A big plus, right? You must have heard that ‘engaged audiences are more likely to become loyal customers’, and it has always stood the test of time and a dynamic market.
We suggest adding questions or humor to your ad copy to encourage more interactions.
9. Frequency- Are you annoying your audience?
Frequency measures how many times the same person sees your ad on average. While some repetition is good, too much can lead to ad fatigue and lower engagement.
On average, if the frequency is above 3-4, users might start ignoring your ad.
It is interesting to note that overexposure can make people associate your brand with spammy advertising.
If frequency is high but performance is dropping, refresh your ad creatives or adjust targeting to reach new audiences.
10. Ad Placement Metrics- Where are your ads performing best?
Facebook ads can appear in different locations—News Feed, Instagram Stories, Messenger, etc. Understanding which placement works best can help optimize your ad spend.
Why are we stressing about Ad placements? Because
- Cost differences: Some placements have lower CPCs than others.
- Engagement variance: Instagram Stories might perform better for video ads, while Facebook Feed is great for text-heavy ads.
- User behavior differences: People interact differently with ads depending on where they see them.
Use Facebook’s Ad Manager > Breakdown > Placement to compare performance across different placements and shift budget accordingly.
Final thoughts
Facebook remains a dominant force in digital advertising that boasts over 3.06 billion active users each month. And Facebook ads can be a goldmine—but only if you track the right metrics. Instead of guessing, use data to make smarter ad decisions.
Ready to take your ads to the next level? Start analyzing your metrics today and watch your ad performance skyrocket!
FAQs
Regular monitoring is crucial. Depending on your campaign's scale and duration, reviewing metrics daily or weekly can help you make timely adjustments.
A "good" CTR varies by industry and campaign objective. However, the average CTR across all industries is approximately 0.90%.
To enhance your ad's relevance score, ensure your content is highly relevant to your target audience. Use high-quality visuals, compelling copy, and proper audience segmentation.
Impressions count the total number of times your ad is displayed, while reach measures the number of unique users who have seen your ad at least once.
High CPC can result from several factors, including poor audience targeting, high competition in your industry, or low ad relevance. Refining your targeting and ad creatives can help lower CPC.
A good ROAS depends on your business model, but the average ROAS benchmark across industries is 2.5 to 4.0. This means for every $1 spent, you generate $2.50 to $4.
Use demographic breakdowns and audience insights in Facebook Ads Manager. If engagement is low, consider adjusting your audience targeting.
If your goal is brand awareness, focus on CPM (Cost Per Thousand Impressions). If you want website traffic or conversions, CPC (Cost Per Click) is more important.
A high CTR but a low conversion rate means users are clicking but not taking action. This could be due to: a poor landing page experience, a misleading ad, a complex checkout process.
The best placement depends on your campaign. However, Facebook News Feed and Instagram Stories generally perform well for engagement and conversions. Test different placements and optimize based on performance.
Sources
- Facebook. Metrics that matter
- WordStream. Facebook Ad Benchmarks for YOUR Industry
- WebFx. Important Facebook Ad Metrics to Track for ROI
- Facebook. Metrics for ads
- Facebook. Create custom metrics in Meta Ads Manager
- Facebook. About estimated, in-development metrics and third-party metrics
- Facebook. Metrics for Automated Ads
Manisha is a Data-Driven Marketing Expert who turns numbers into narratives and ad clicks into conversions. With a passion for performance marketing and a sharp eye for analytics, she helps brands cut through the noise and maximize their impact in the digital space.
Leszek is the Digital Growth Manager at Feedink & Cropink, specializing in organic growth for eCommerce and SaaS companies. His background includes roles at Poland's largest accommodation portal and FT1000 companies, with his work featured in Forbes, Inc., Business Insider, Fast Company, Entrepreneur, BBC, and TechRepublic.
Related Articles


How Can Cropink Help?
Start with Cropink is easy and free
No credit card required