What is a Good CTR for Facebook Ads in 2026?
A good Facebook Ads CTR ranges from 0.90% to 1.60%, meaning 9 to 16 clicks per 1,000 impressions. This guide breaks down industry benchmarks, what counts as low under 0.5%, and how CTR affects CPC, reach, relevance score and overall ad performance.


For most Facebook advertisers, a link CTR between 1% and 2% is healthy.
Below 0.5% usually signals a targeting or creative problem.
And above 2% is strong, but only if those clicks convert.
That's the benchmark.
But to use it correctly, you need to understand which CTR metric matters, where your number comes from, and what to do if you're underperforming.
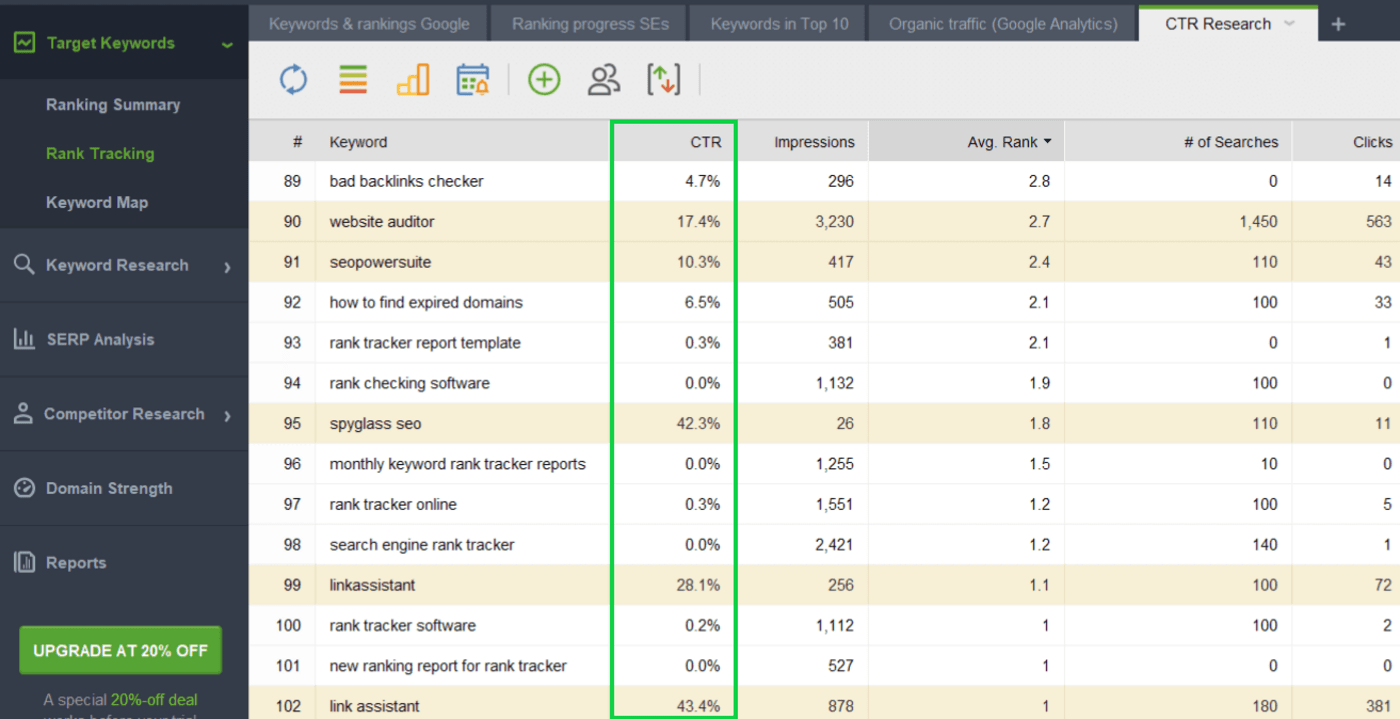
What is CTR and how to calculate it
CTR stands for Click-Through Rate. It's the percentage of people who saw your ad and clicked it.
Formula: CTR = (Clicks ÷ Impressions) × 100
For example, if your ad gets 120 clicks from 10,000 impressions, your CTR is 1.2%.
Simple.
But here's where most advertisers get confused.
Which CTR metric should you actually use?
Meta tracks multiple CTR-related metrics.
They mean different things.
Link CTR (most important for e-commerce and traffic campaigns). The percentage of impressions that resulted in a click to your landing page or website. This is what you should use to judge performance for most campaigns.
CTR (all). Every click on your ad counts—including clicks on the ad headline, image, or caption that don't lead anywhere. This number is always higher than link CTR and less useful for judging business results.
Outbound CTR. The percentage of impressions that resulted in a click away from Facebook/Instagram. Similar to link CTR but measured differently in older reporting.
Unique CTR. The percentage of unique users who clicked your ad. Useful when frequency matters, but less common for judging raw performance.
For most campaigns, track link CTR. That's the metric that tells you whether your ad is actually driving traffic.
What's a good CTR in 2026? By campaign type
Your benchmark depends on what you are trying to do.
Prospecting campaigns (cold audience)
- Low: Below 0.5%
- Average: 0.5% - 1%
- Good: 1% - 2%
- Strong: Above 2%
Retargeting campaigns (warm audience)
- Low: Below 1%
- Average: 1% - 2%
- Good: 2% - 4%
- Strong: Above 4%
E-commerce catalog ads
- Low: Below 0.8%
- Average: 0.8% - 1.5%
- Good: 1.5% - 3%
- Strong: Above 3%
Lead generation campaigns
- Low: Below 0.7%
- Average: 0.7% - 1.2%
- Good: 1.2% - 2.5%
- Strong: Above 2.5%
Retargeting users always click more. They recognize your brand and have seen your offer before. Don't compare cold traffic CTR to warm traffic CTR; they're in different leagues.
Average CTR by industry (2026)
CTR varies by objective, audience, placement, and offer.
So, use this as a directional benchmark, not a rule. Your number may differ significantly based on your specific campaign setup.
| Industry | Average CTR |
|---|---|
| Art and Home Decor | 2.92% |
| Clothing and Fashion | 2.84% |
| Books and Media | 2.34% |
| Health and Wellness | 2.08% |
| Home and Garden | 1.98% |
| Dogs, Cats, and Pets | 1.94% |
| Food and Beverage | 1.85% |
Why CTR matters (but isn't everything)
A strong CTR means two things:
First: Your ad is relevant. The message, image, and audience are aligned. Facebook rewards this with
better placement and lower costs.
Second: Your creative is attention-grabbing. In a feed full of distractions, your ad stopped the scroll.
But here's the catch: High CTR with low conversion rate is a warning sign. It means your ad is curiosity-driven, but the landing page, offer, or product doesn't match the promise. You're driving traffic that doesn't convert.
Track CTR alongside conversion rate, cost-per-action (CPA), and return-on-ad-spend (ROAS). All three together tell the real story.
For a deeper dive into how CTR connects with your overall ad costs and efficiency, read our Facebook Ads scaling guide.
What to do if your Facebook ads CTR is below 0.5%
Below 0.5% CTR usually means one of three things is broken. Start here:
- Check your offer clarity first. Does your ad immediately explain what you're selling or offering? If someone sees your ad for 2 seconds, do they understand the value? If not, rewrite your copy or add a clear headline.
- Review your audience-offer match. Is your targeting too broad? Are you showing a luxury product to a budget-conscious audience? Use custom audiences, lookalike audiences, or interest refinement to narrow your audience to people who actually want what you're selling.
- Evaluate your creativity. Does your image or video stop the scroll? Bright, bold, relevant visuals outperform plain product photos. Add contrast, human faces, or movement. If you're running the same creative for more than 3 weeks, fatigue is likely.
- Check your placement and frequency. If frequency is high (users are seeing your ad 5+ times), they're ignoring it. Refresh the creative or expand your audience. If you're running in placements where competitors dominate, test Stories, Reels, or Audience Network instead.
- Verify your landing-page promise. If the ad says "Free trial" but the landing page asks for a credit card, users will click less. Make sure the click destination matches the ad promise.
Start with #1 and #2.
Most low CTR problems are offer clarity or audience fit, not creative.
How E-commerce brands can improve CTR in catalog ads
For product advertisers, CTR often depends on how much information the ad shows at a glance.
A plain product photo might not be enough when users scroll past dozens of similar items every day. Strong catalog ads make the decision easier: they show the price, discount, delivery badge, rating, or seasonal label right in the creative.
Instead of designing every product ad manually, feed-based tools like Cropink pull product data from your catalog and apply it to dynamic templates. For example, a fashion retailer can automatically show the sale price, discount badge, brand logo, and customer rating on each product. The result? Ads that feel more relevant and specific to each shopper.
A good CTR usually means the creative made the product, offer, and next step clear enough in a few seconds. For catalog ads, that clarity often comes from the product feed itself: price, discount, rating, delivery, and other details that help a shopper decide whether the click is worth it.

CEO at Cropink & Feedink
The goal is not to decorate the image. The goal is to make the click decision easier and faster.
CTR vs Conversion rate: When high clicks are misleading
This is important: CTR is an attention metric. Conversion rate is a business metric.
You can have great CTR and terrible conversions. This happens when:
- The ad headline is sensational but misleading ("You won't believe what happens next")
- The offer is too good to be true, and users suspect a scam
- The landing page loads slowly or feels untrustworthy
- The product quality doesn't match the ad promise
In these cases, CTR looks good, but ROI is terrible.
Always judge your ads in this order:
- CTR (is the ad getting attention?)
- Conversion rate (do clicks turn into customers?)
- CPA (how much does each customer cost?)
- ROAS (does the revenue exceed the ad spend?)
A 2% CTR with a 1% conversion rate is better than a 4% CTR with a 0.2% conversion rate.
Don't optimize for CTR alone.
Factors that affect your CTR
Audience targeting.
Wrong audience = low CTR, no matter how good your creative is. Use custom audiences, lookalike audiences, and interest refinement to reach people who actually want what you're selling.
Ad relevance.
Facebook rates how well your ad matches user interests. Low relevance = lower placement and higher costs. Clear, targeted messaging wins.
Creative quality.
Bright, bold, scroll-stopping visuals outperform generic designs. Video usually beats static images. Human faces beat product-only shots. Test everything.
Ad placement.
Different placements deliver different CTRs. Facebook Feed averages 1.11% CTR, while Instagram Stories lead with 1.34% CTR, 61% higher engagement due to the full-screen format.
Instagram Reels average 0.76% link CTR but drive stronger video engagement metrics (watch time, completion rates), making them ideal for awareness over direct clicks. Audience Network performs inconsistently depending on site quality. Test each placement separately before allocating budget.
Time and frequency.
Ads shown at odd hours to exhausted users perform worse. If frequency is high (users see the ad 5+ times), CTR drops from fatigue. Rotate creatives every 2-4 weeks.
Landing page match.
If the landing page doesn't match the ad promise, users won't click. Make sure your destination is relevant and loads fast.
How often should you refresh your ad creatives?
Test and rotate continuously. A good rule of thumb:
- Every 2-4 weeks, if you have a large audience and high frequency
- Every 4-6 weeks for smaller audiences or retargeting
- Immediately, if CTR drops more than 20% week-over-week
Watch for frequency creep. If frequency is above 4 (your audience sees the ad more than 4 times), refresh the creative even if CTR is still decent. Fatigue is starting.
For more tactical advice on testing and optimization, check out our Facebook Ads testing and optimization rulebook.
Use these insights to benchmark your ads:
- Frequency Facebook Ads
- Minimum Budget for Facebook Ads
- Facebook Ads
- Scale Facebook Ads
- Facebook DPA Design
- Facebook Dynamic Product Ads
FAQs
What is the average CTR for Facebook Ads in 2026?
It depends on the campaign type. For cold prospecting, 0.5%-1% is average. For retargeting, 1%-2% is average. For catalog ads, 0.8%-1.5% is typical. The industry benchmark across all ads is roughly 0.9%-1.6%.
Is 0.5% CTR bad?
It depends on context. For retargeting, 0.5% is low and needs attention. For cold prospecting, 0.5% is near average. Check your campaign type and goal first.
What is the difference between CTR and link CTR?
CTR (all) includes every click on your ad. Link CTR counts only clicks that go to your landing page or website. Link CTR is lower, but more useful for business results. Use link CTR to judge performance.
Is a high CTR always good?
No. High CTR with low conversion rate means your ad attracts clicks, but the landing page or offer doesn't deliver. Always check conversion rate and CPA alongside CTR.
How do I calculate Facebook Ads CTR?
Divide clicks by impressions and multiply by 100. Example: 150 clicks ÷ 10,000 impressions × 100 = 1.5% CTR.
Can I improve CTR on existing campaigns?
Yes. Refresh the creative, tighten your audience targeting, test different placements, or improve your landing page. Start with creative and audience changes first.
Do catalog ads have different CTR than regular ads?
Often yes. Catalog ads with product data (price, discount, rating) usually have higher CTR than plain product photos because they provide more information at a glance. Using a feed-based tool to enrich your catalog ads can improve CTR by 20-40%.
What CTR should I aim for in 2026?
Aim for above 1% link CTR for cold traffic and above 2% for retargeting. But always compare against your own baseline and your industry benchmark first. Then focus on conversion rate and ROAS alongside CTR.
Sources
- Lebesgue, 2026. Facebook Benchmarks by Industry: CTR, CPM, CR, and CAC
- AdAmigo.ai. Meta Ads Benchmarks
Manisha is a Data-Driven Marketing Expert who turns numbers into narratives and ad clicks into conversions. With a passion for performance marketing and a sharp eye for analytics, she helps brands cut through the noise and maximize their impact in the digital space.
Leszek is the Digital Growth Manager at Feedink & Cropink, specializing in organic growth for eCommerce and SaaS companies. His background includes roles at Poland's largest accommodation portal and FT1000 companies, with his work featured in Forbes, Inc., Business Insider, Fast Company, Entrepreneur, BBC, and TechRepublic.
Related Articles


How Can Cropink Help?
Start with Cropink is easy and free
No credit card required