30+ Instagram Statistics You Need to Know for Marketing Success [2026]
Instagram has over 2 billion monthly users, 200 million active businesses, and influences purchase decisions for 61% of shoppers. This article breaks down 30+ Instagram statistics covering Reels, ads, influencers, and usage trends to help marketers increase reach, engagement, and conversions.


![30+ Instagram Statistics You Need to Know for Marketing Success [2026]](https://honest-garden-2954e8e7e9.media.strapiapp.com/instagram_statistics_thumbnail_70a0b731e8.png)
Facebook knew exactly what they were doing when they acquired Instagram in April 2012 for $1 billion.
What started as a simple photo-sharing app for friends and family has evolved into a multi-billion dollar platform where businesses now connect with their audiences.
The platform has become increasingly competitive as well. The latest Instagram statistics show that Instagram has an estimated 200 million active businesses.
If you want to know what content drives engagement and what your potential audience wants from the platform, we have the numbers for you.
Key Instagram stats
- Half of the time Instagram users spend on the app is dedicated to watching Reels
- Carousels have the highest engagement at 0.55%, followed by Reels at 0.50%
- 90% of Instagram users follow a business, and 61% turn to Instagram to find their next purchase
- Over half of global Instagram users are 34 or younger
- Instagram's influencer marketing spending reached $2.21 billion in 2024
General Instagram statistics
Just how popular is Instagram?
Our latest Instagram statistics show that the platform is the 2nd most downloaded app after TikTok, with 817.49 million downloads.
In 2024, Instagram's user base increased by 25% compared to the previous year. It added roughly 70 million new users.
By early 2024, Instagram hit 2 billion monthly active users. It’s now the 3rd most used app after Facebook (3+ billion) and YouTube (2.5+ billion).
Surprisingly, most users do not come from the app's home base, the US.
Instead, India has the most Instagram users (360 million), followed by the US (169 million) and Brazil (134 million).
More interestingly, over half of Instagram's global users are 34 or younger.
How much time do people spend on Instagram?
Users spend about 16 hours and 49 minutes monthly, which is about 34 minutes daily.
Engagement is also high, as nearly two-thirds of users check in at least once daily, and 42% return multiple times.
Industry performance on Instagram
Different industries see varying levels of success on Instagram. Content and Apps lead the pack with an average of 105,000 followers, while Home & Auto and Publishers follow with 75,000 and 70,000 followers, respectively.
Even industries with lower follower counts, like Food & Personal Goods (~25,000), maintain significant audiences.
Average number of followers by business category
| Business Category | Average Number of Followers |
|---|---|
| Content & Apps | ~105,000 |
| Home & Auto | ~75,000 |
| Publishers | ~70,000 |
| Auto Dealers | ~50,000 |
| Creators & Celebrities | ~45,000 |
| Personal Goods & General | ~30,000 |
| Food & Personal Goods | ~25,000 |
Instagram usage statistics
Which age group uses Instagram the most?
Statista reports it’s people between 18 and 24. They make up 31% of total users. The 25-34 age group follows closely at 30.6%.
Instagram user demographics by age
| Age Group | Percentage of Users |
|---|---|
| 18-24 | 31.70% |
| 25-34 | 30.60% |
| 35-44 | 16.00% |
| 45-54 | 8.70% |
| 55-64 | 4.60% |
| 65+ | 2.90% |
Instagram user demographics by gender
Men slightly edge out women on Instagram, with males making up 50.6% of users compared to females at 49.4%. The most active group is men between 18 and 24 years old.

| Gender | Percentage of Users |
|---|---|
| Male | 50.60% |
| Female | 49.40% |
Instagram Reels statistics
Even though it was introduced 9+ years after the launch of Instagram, Reels have become a favorite for Instagram users.
In fact, half of the time Instagram users spend on the app is dedicated to watching Reels.
What does this mean for your brand?
If you implement Reel ads, you can expect to reach approximately 726.8 million people.
The appetite for this content format is huge. According to a 2022 report, users spent a combined total of 17.6 million hours per day watching Reels.
On average, Instagram users post 1.32 times per day, mixing their content between:
- 39.8% photos
- 35.9% Reels
- 21.6% carousels
When it comes to engagement, Reels perform reasonably well.
They secure a 0.50% engagement rate, just slightly behind carousels (0.55%).
What about views?
Here's what you can expect based on your follower count:
| Brand size | Avg. Instagram Reel Views |
|---|---|
| 1k - 5k followers | 308 |
| 5k - 10k followers | 570 |
| 10k - 50k followers | 1,650 |
| 50k - 100k followers | 3,100 |
| 100 → 1M followers | 15,000 |
However, Reel reach decreased by 20% in 2024, according to a Metricool study. This isn't necessarily bad news. It just means the space is getting more competitive as more businesses recognize the power of Reels.
Instagram Stories statistics
Should you bother with Stories?
If these Instagram statistics are anything to go by, then yes.
Users share 1 billion Stories daily across Facebook's apps. That number alone shows the massive potential for reaching your audience through this format.
Now, how many times should you post?
The most successful brands (top 25%) post around 20 Stories monthly. They've found this frequency keeps their audience engaged without overwhelming them.
Speaking of engagement, there's a science to Story length.
Stories with just one frame see a 14% exit rate. But by the fifth frame, that number drops to about 5% and stays there.
Despite this, most brands play it safe because about 60% stick to 1-3 frames per Story, and only 10% venture beyond 7 frames.
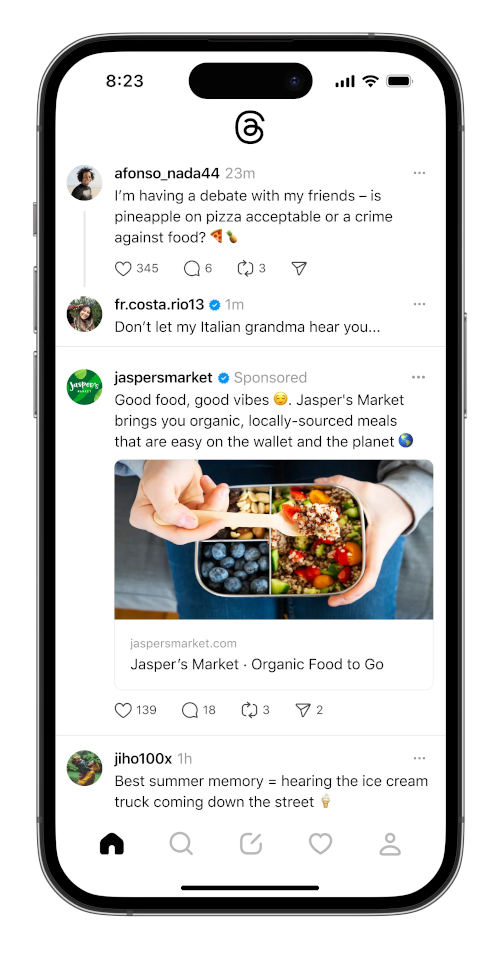
Instagram Threads statistics
Meta launched Threads as an alternative to X, and the numbers show it's gaining traction fast.
The platform now has 320 million monthly active users, with 100 million logging in daily.
Time spent on the app is growing, too. Between May and August 2024, Android users increased their time from 22 to 34 minutes monthly on the app.
What's new for marketers?
Meta is now testing ads on Threads. Advertisers will now extend their Instagram campaigns to the platform with minimal effort.
Here’s a sneak peek of what ads on Threads will look like:
Instagram for business statistics
Should you market your business on Instagram in 2025?
A resolute yes!
One, it’s the #2nd most popular platform for advertising after Facebook. About 79% of marketers across the globe use Instagram to advertise businesses.
And if that’s not convincing enough, know that 200 million other businesses are already active on Instagram.
Is it worth it?
Yes, again.
After all, 1 in 2 Instagram users are open to connecting with brands daily. More importantly, 61% of social users turn to Instagram to find their next buy.
What do users want to see from brands?
About 66.60% log into Instagram for funny or entertaining content. Another 54.40% come for news updates and keeping up.
So, if you want to win over your audience on Instagram, make your content relevant, fresh, entertaining, or at least interesting.
| Reason for Using Instagram | Percentage (%) |
|---|---|
| Post or share photos or videos | 70.10% |
| Look for funny or entertaining content | 66.60% |
| Follow or research brands and products | 62.30% |
| Message friends and family | 59.70% |
| Keep up to date with news and current events | 54.40% |
Instagram Ad statistics
Instagram ads reach 1.6 billion adults globally.
Feed content drives most of Instagram's success as it brings in 53.7% of ad revenue, while Stories adds another 24.6%.
But how much exactly does it cost to advertise on Instagram?
CPC on Instagram is $0.01- $0.25 according to WebFx, and cost per 1,000 impressions (CPM) is $0.01 – $4.
Conversion rates across Instagram, regardless of objectives, are between 1%-2%. Higher-performing campaigns can get to 3%.
Instagram Ads conversion rates by campaign objective
| Campaign Objective | Average Conversion Rate (%) |
| Brand Awareness | 0.5% - 1.0% |
| Reach | 0.3% - 0.8% |
| Traffic | 1.0% - 2.0% |
| Engagement | 2.0% - 3.0% |
| App Installs | 0.8% - 1.5% |
| Video Views | 0.5% - 1.2% |
| Lead Generation | 1.5% - 3.0% |
| Conversions | 1.0% - 3.0% |
| Catalog Sales | 1.5% - 3.5% |
| Store Traffic | 0.5% - 1.5% |
Instagram influencer marketing stats
Instagram remains the top platform for influencer marketing in 2025.
Almost all (98%) of US influencers run campaigns on Instagram, while 72% use Facebook.
More interestingly, US marketers favor Instagram Reels over TikTok for influencer partnerships.
Brands invested $2.21 billion in Instagram influencer campaigns in 2024, a $251.7 million jump from the previous year. This spending nearly doubles TikTok's $1.25 billion influencer marketing budget.
Interesting Instagram statistics
Instagram is the #6th most searched term online, with over 124 million searches.
Kevin Systrom, Instagram's co-founder, uploaded Instagram’s first post.
Los Angeles is the most geo-tagged city worldwide, with London, New York, and São Paulo following closely behind.
Instagram is banned in several countries, including Russia and China.
The most followed accounts on Instagram:
- Instagram – 685 million followers
- Cristiano Ronaldo – 649 million followers
- Lionel Messi – 504 million followers
- Selena Gomez – 421 million followers
- Dwayne "The Rock" Johnson – 394 million followers
- Kylie Jenner – 394 million followers
- Ariana Grande – 376 million followers
- Kim Kardashian – 358 million followers
- Beyoncé – 312 million followers
- Khloé Kardashian – 304 million followers
Instagram’s Threads reached 100 million users in less than 5 days. Within 2 hours of launch, it had #2 million users.
FAQs
Instagram is incredibly popular for businesses. Over 200 million businesses are active on the platform. Instagram is also the #2nd most popular platform for advertising, with 79% of marketers using it globally.
Carousels get better engagement (0.55%). Reels follow closely with an engagement rate of 0.50%.
Instagram's largest user demographic is between the ages of 18 and 24. The 25-34 age group closely follows with 30.6% of users.
Users spend 16 hours and 49 minutes monthly on Instagram, or roughly 34 minutes daily. Two-thirds of users check in at least once a day.
Wrapping up
These Instagram statistics show why the platform has become essential for business growth.
Its 2 billion users, predominantly young audience, and strong brand engagement make it a powerhouse for reaching new customers.
When half your potential customers are open to connecting with brands on Instagram, the opportunity is too big to ignore.
Sources
- Statista. Top downloaded mobile apps worldwide.
- Backlinko. Instagram user statistics.
- Statista. Global social networks ranked by number of users.
- Statista. Instagram.
- Oberlo. Average time spent on social media.
- Mention. Instagram followers statistics.
- Statista. Instagram global age group statistics.
- Adam Connell. Instagram Reels statistics.
- WSJ. Instagram Reels, TikTok, Meta, Facebook documents.
- We Are Social. Digital.
- Social Insider. Social media benchmarks Instagram.
- Metricool. Social Media Study.
- Rival IQ. Instagram Stories benchmark report.
- Data Reportal. Digital global statshot.
- Facebook. Introducing ads in Threads.
- Statista. Social media platforms used by marketers worldwide.
- Business Dasher. Instagram statistics for business.
- Sprout Social. Social content strategy report.
- eMarketer. Instagram will make up more than half of Meta’s US ad revenues.
- WebFX. How much does social media advertising cost?
- Driftlead. Instagram ads conversion rates by industry
- eMarketer. Facebook advertising statistics.
- Hootsuite. Instagram statistics.
- SimilarWeb. Top keywords for SEO.
- Instagram. Instagram post.
- Epidemic Sound. Most followed on Instagram.
Damaris is a Digital Marketing Specialist who writes about digital marketing and performance marketing. At Cropink, she creates data-driven content to help businesses run better ad campaigns for better performance and ROI.
Leszek is the Digital Growth Manager at Feedink & Cropink, specializing in organic growth for eCommerce and SaaS companies. His background includes roles at Poland's largest accommodation portal and FT1000 companies, with his work featured in Forbes, Inc., Business Insider, Fast Company, Entrepreneur, BBC, and TechRepublic.
Related Articles


How Can Cropink Help?
Start with Cropink is easy and free
No credit card required