40+ X (Twitter) Statistics You Need To Know [2026]
X (Twitter) reaches 600 million active users who spend 7.8 billion minutes daily, yet just 10% generate 92% of all tweets. This report breaks down user demographics, engagement decline, ad performance, and why X Premium users stay 3x longer on the platform.


![40+ X (Twitter) Statistics You Need To Know [2026]](https://honest-garden-2954e8e7e9.media.strapiapp.com/x_twitter_statistics_thumbnail_f6af1e348e.png)
Did you know that X (Twitter) boasts over 600 million active users, with 7.8 billion minutes spent on the platform every day?
Despite shifts in social media habits, it remains a key player in digital marketing. In this article, we’ll explore essential X (Twitter) statistics for 2025, from user demographics to engagement trends.
Get the data you need to optimize your strategy, boost brand visibility, and stay ahead of the curve in the ever-evolving world of social media.
Key X (Twitter) stats
- X (Twitter) has 600 million monthly active users, with 54.8% aged 18-34.
- The top 10% of users create 92% of all tweets, while most just scroll.
- Engagement is down—likes per post dropped from 37.8 in 2023 to 31.4 in 2024.
- X Premium users spend 3x more time on the platform than regular users.
- Ads on X saw a 22% boost in engagement, but ad revenue is projected to decline.
- 79% of users follow at least one brand, making X key for business marketing.
X (Twitter) usage statistics
By May 2024, X (Twitter) had around 600 million active users each month, and more than half of them logged in daily. Each day, users spend more than 7.8 billion active minutes on the platform. The average user spends 32 minutes daily on X (Twitter).
As of April 2024, it ranked as the 12th most popular social media app worldwide.
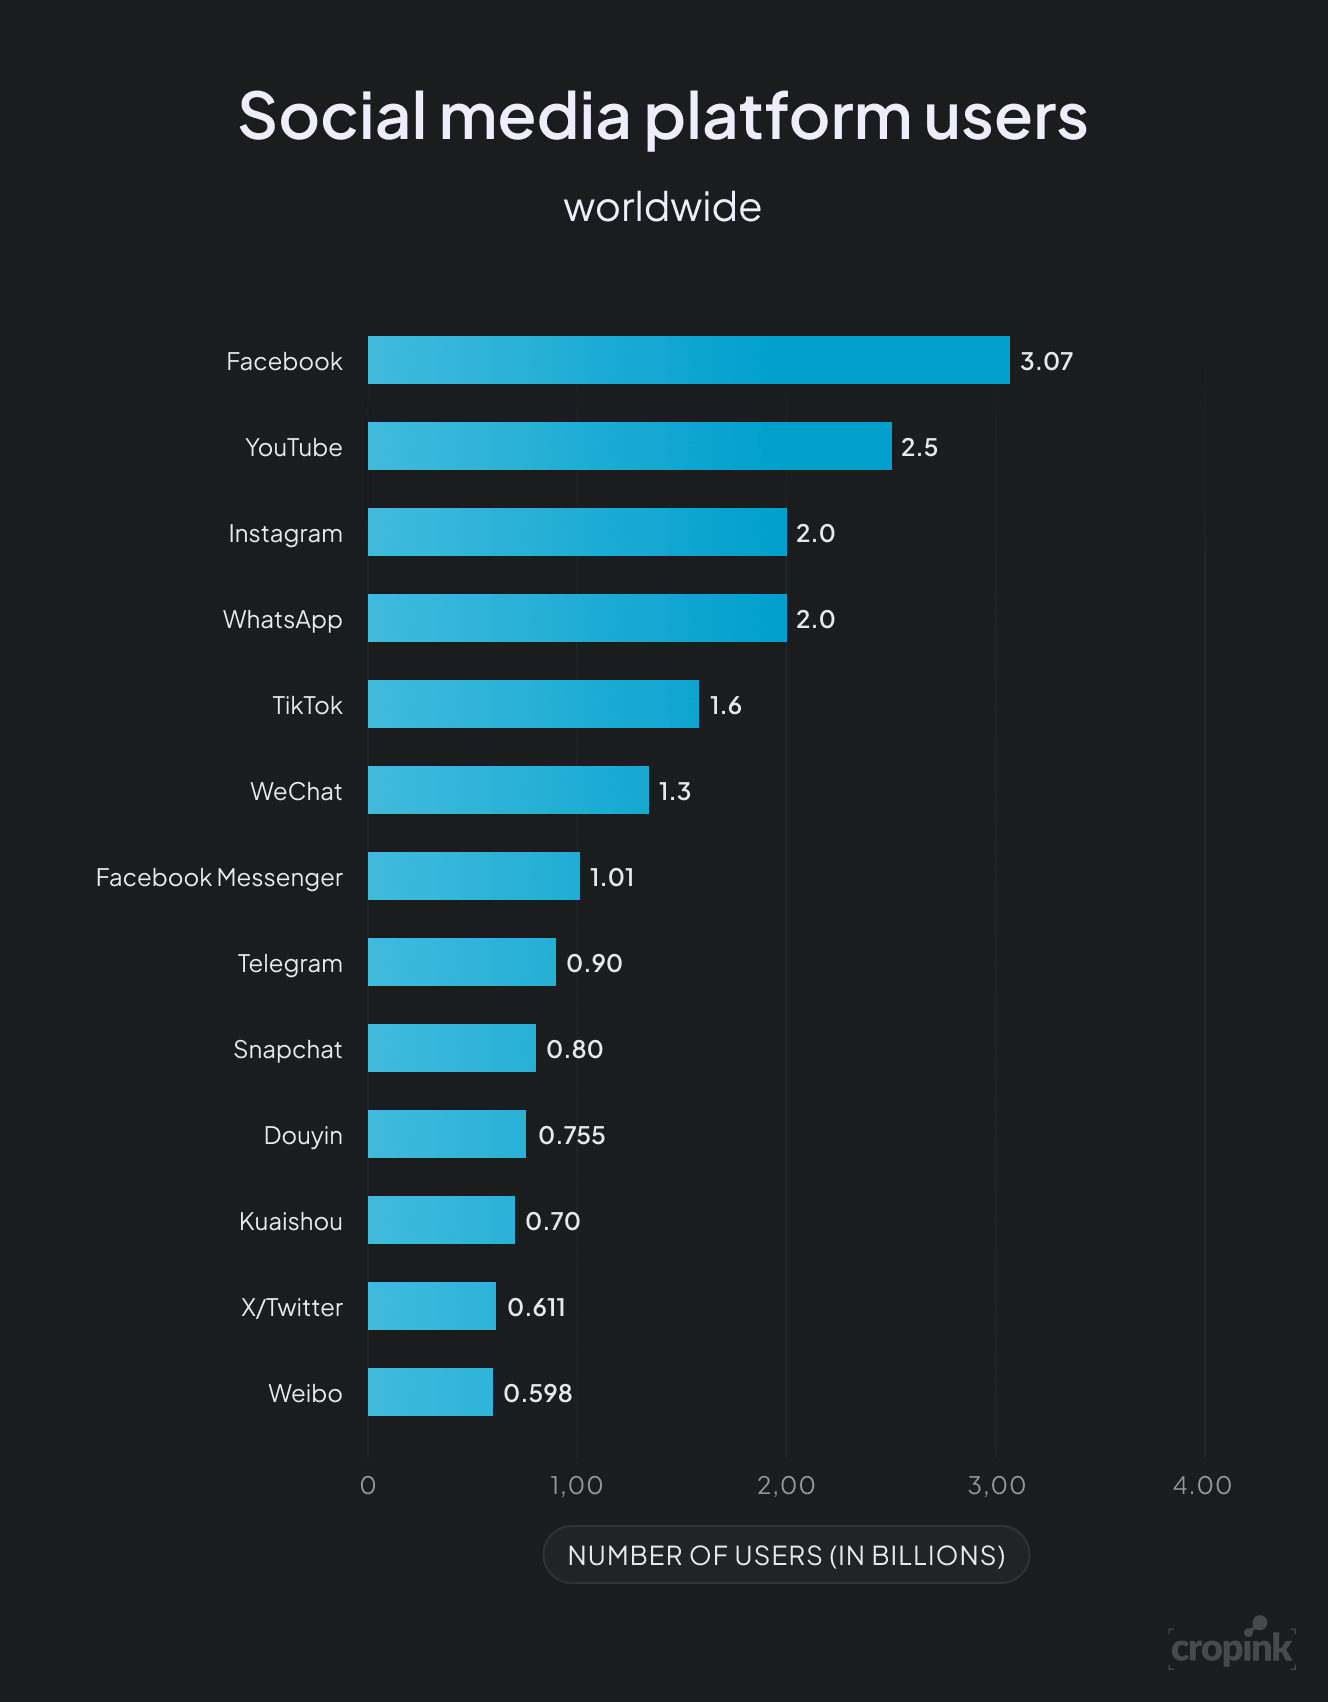
Overall, Twitter connects with 12.6% of internet users across the globe.
The United States is the top country using Twitter, with over 108 million users. Japan comes in second with 74.1 million, followed by India in third place with 30.3 million users.
X (Twitter) user demographics
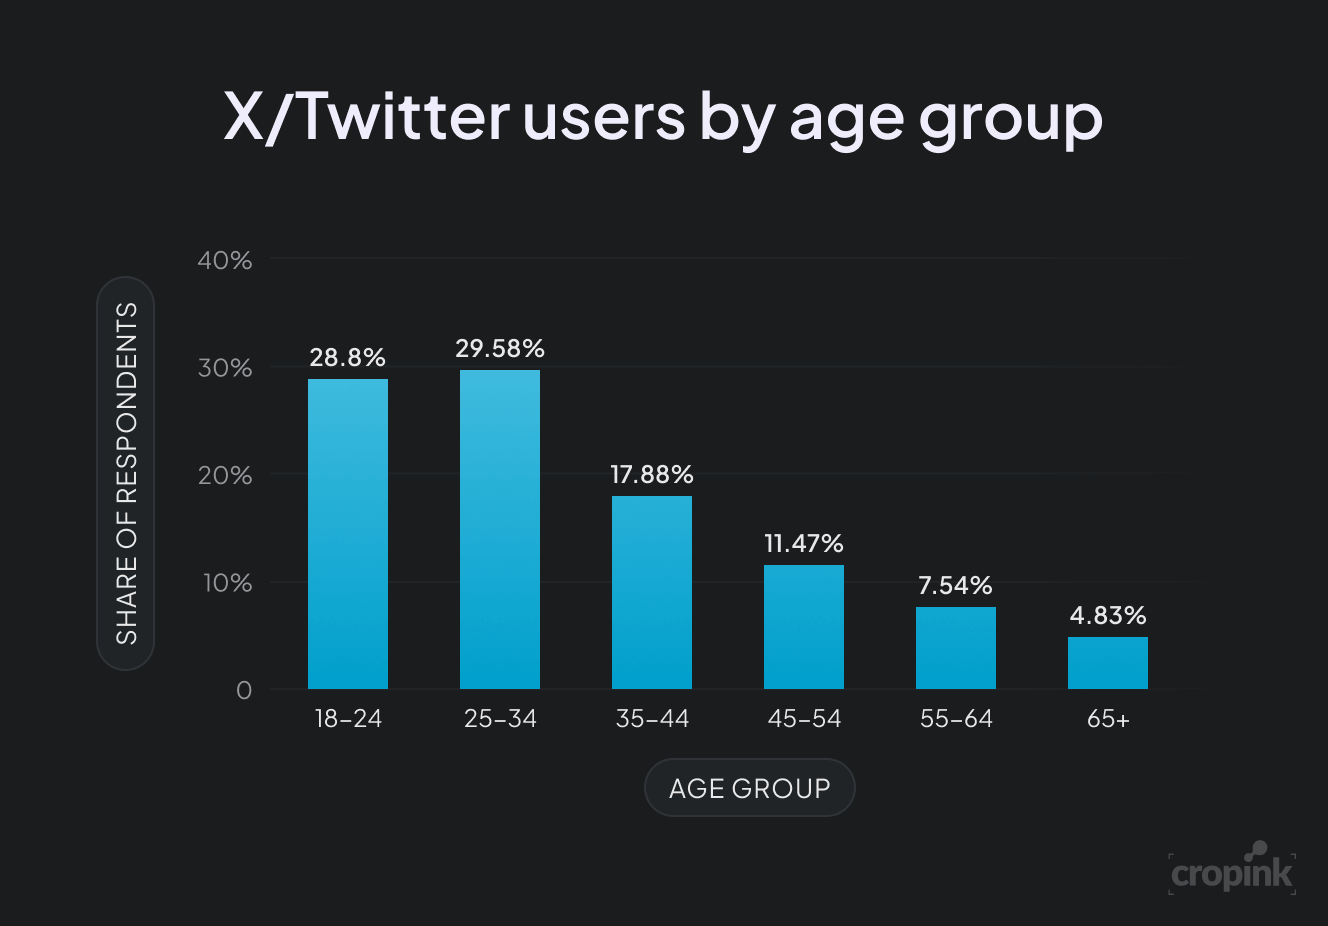
X (Twitter’s) user base is mostly young, with 54.8% of users aged between 18 and 34.
Most X (Twitter) users are male, making up 61.2% of the platform’s audience, while 38.8% are female. In contrast, other social media platforms like Instagram (49.7% female users) and LinkedIn (43.4% female users) have a more balanced gender split.
People use X (Twitter) for different reasons—48% scroll for news, while another 48% look for entertainment. About 34% use it to stay connected with friends and family, 33% follow brands or companies, and 14% use it for professional networking.
X (Twitter) premium subscriber statistics
X Premium subscribers spend three times more time on the platform than regular users. Currently, 650.000 people are subscribed to the service.
Ahead of Christmas and Black Friday, X rolled out a 40% discount on X Premium, featuring full-screen, unavoidable in-app promotions. The combination of major discounts and a new option to gift X Premium helped boost subscriber numbers in November. According to AppFigures, sign-ups have stayed higher than usual ever since.
X (Twitter) content and engagement statistics
On X (Twitter), just 10% of users generate a massive 92% of all tweets, meaning most people are there to consume content rather than create it.
For businesses, this presents an opportunity to maximize reach when advertising products or services.
However, engagement on X (Twitter) has declined in 2024. The average number of likes per post dropped from 37.82 in 2023 to 31.46 in 2024, while mentions and reposts also saw a year-over-year dip. The average post now gets 1.56 likes and 8.47 mentions.
Engagement rates vary by industry, with the overall platform average sitting at 0.029% in 2024. Sports teams see the highest engagement at 0.072%, while media brands experience the lowest at just 0.009%
X (Twitter) revenue statistics
Back in 2007, X (Twitter) was valued at just $220,000 during its first funding round. By 2023, the company generated an estimated $2.98 billion in ad revenue—a 28% drop from 2022. As a public company in 2021, X (Twitter) reported $5.01 billion in annual revenue.
X (Twitter) has paid out over $20 million to its creator community.
X (Twitter) marketing statistics
Ads on X (Twitter) saw a 22% boost in engagement in 2023. However, ad spend revenue was expected to drop by 2% in 2024 and another 4% in 2025. The media sector contributes 32.4% of X (Twitter)’s total ad spend.
X (Twitter) claims users spend 26% more time viewing ads on its platform compared to other social media sites. With such strong ad performance, it's no surprise that many brands choose to market there.
In fact, X (Twitter) has seen a 35% year-over-year increase in global ad engagement, making it even more appealing for advertisers. Plus, brands that invest more in Twitter ads are seen as more culturally relevant—and that relevance often translates into higher revenue.
Twitter for business statistics
Businesses use X (Twitter) to share fresh content, promote their products, and engage with their target audience.
X (Twitter) is the second most popular organic social media platform for B2B marketers, with 82% using it—just behind LinkedIn at 96%.
Brands get plenty of attention on X (Twitter), as 79% of users follow at least one. The platform is mainly used for staying updated with news, but many also research brands there.
Globally, among users aged 16-64, 60.6% use Twitter to follow news and current events, 34.9% to research brands and products, and only 27% to post or share media.
When it comes to brand safety, X (Twitter) performs well, with an average safety score exceeding 99% and brand suitability scores over 97% when controls are in place.
X (Twitter) trends and insights
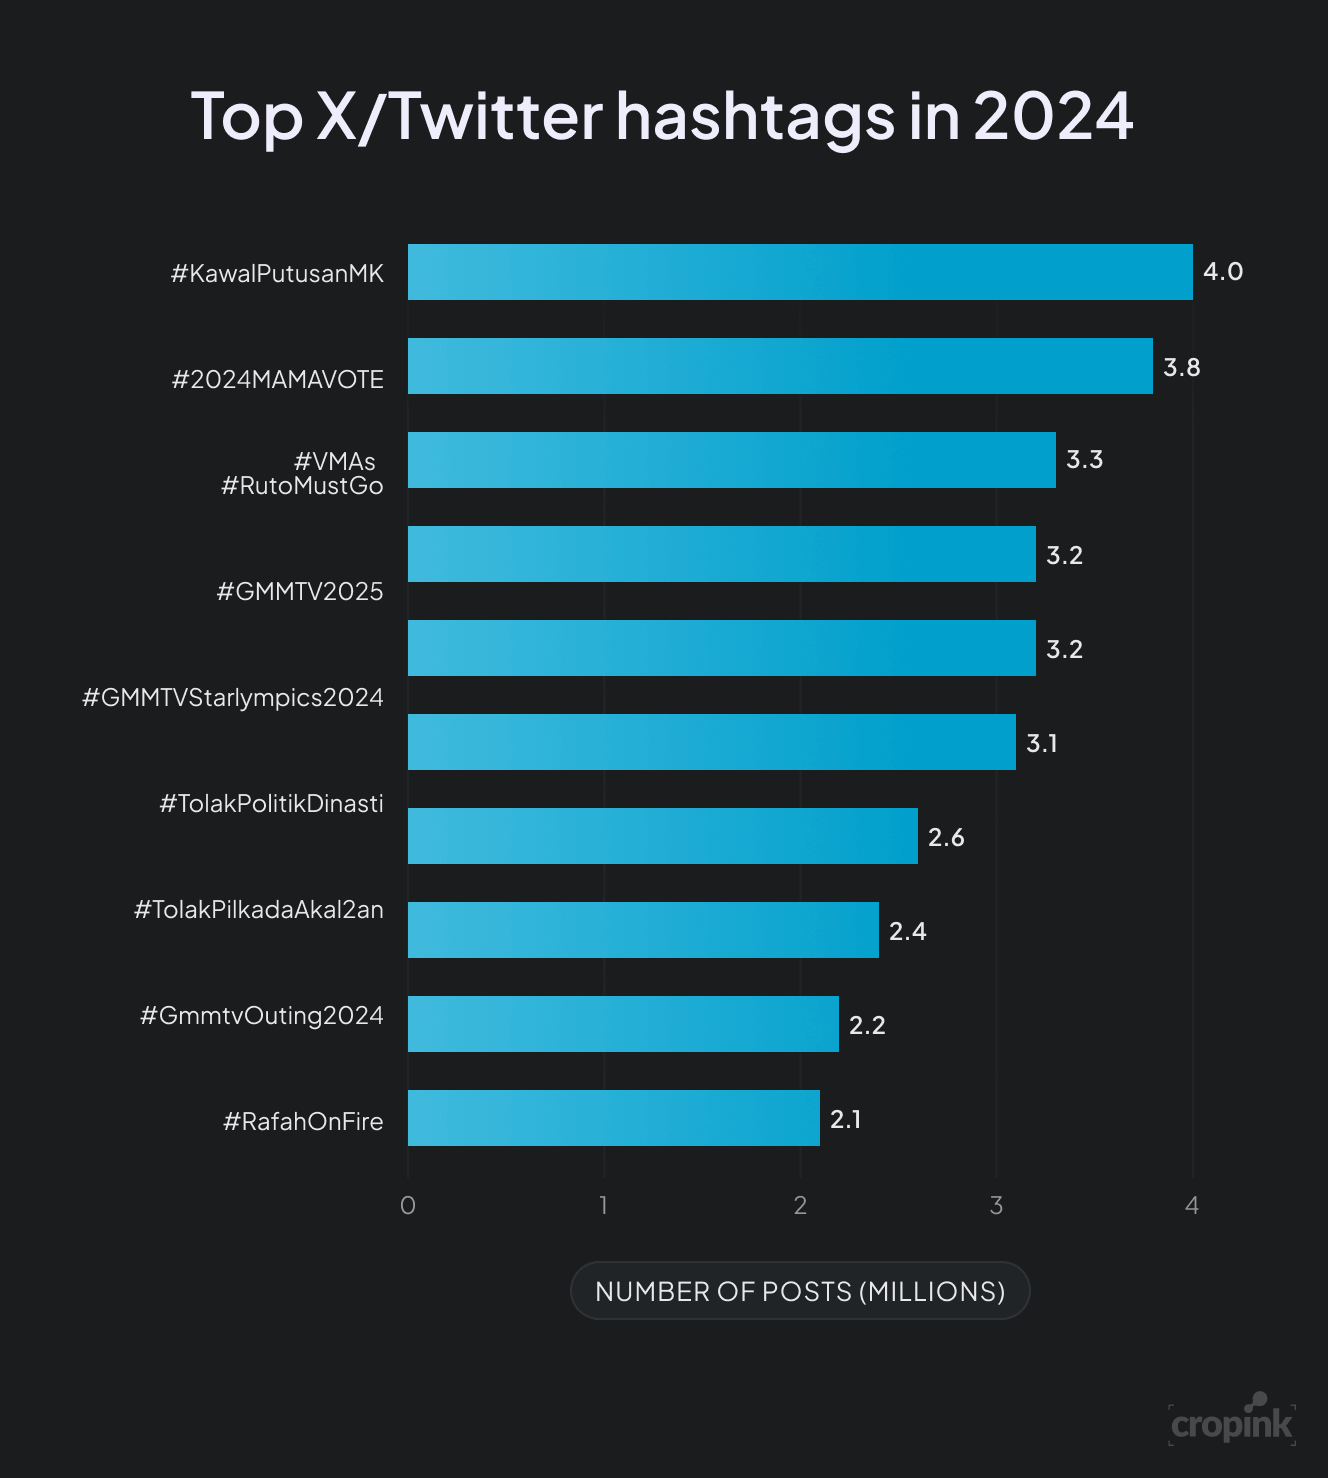
In 2024, the most popular trending hashtags centered around major global events, pop culture moments, and social movements. Trending topics constantly shift based on what’s happening in society, but big events—like a major entertainment awards show or a top artist dropping new music—often dominate.
Seasonal trends also play a role, with hashtags like #Halloween and #Christmas gaining traction at specific times of the year. It’s worth noting that trending hashtags vary by location, with each region having its own unique set of popular topics.
FAQ
Yes, X (Twitter) remains relevant in 2026, with over 600 million users globally. The platform continues to be a hub for real-time news, industry discussions, and brand engagement, particularly in sectors like journalism, tech, and politics. While some users have explored alternatives, X's AI-driven features, monetization options, and community tools help maintain its influence in the digital landscape.
Since rebranding to X in July 2023, Twitter has undergone significant changes, including a new logo and expanded features such as long-form posts and audio-video calls. Content moderation policies evolved and the verification system transitioned to a subscription model, allowing users to purchase verification status.
As of January 2025, X has 2,840 employees, which is nearly a 20% rise from 2023. However, this figure remains 63.8% lower than the workforce size prior to Elon Musk's layoffs in 2022.
The first ever tweet was posted by Jack Dorsey, Twitter’s CEO, on March 21, 2006. It read: “just setting up my twttr”.
Elon Musk bought Twitter for $44 billion in October 2022.
Wrapping up
And that’s a wrap! X (Twitter) remains a key platform for news, marketing, and engagement. With millions of active users and evolving features, it still shapes online conversations worldwide!
Sources
- Backlinko, X (Twitter) Statistics: How Many People Use X?
- Owlead, Best 𝕏 / Twitter Statistics You Need to Know
- Demandsage, Twitter (X) Number of Employees – New Data
- ABC News, Elon Musk underpaid Twitter acquisition by $150M by not disclosing stake, SEC alleges
- Social Shepherd, 21 Essential Twitter (X) Statistics You Need to Know
- Analyzify, X (Twitter) Statistics
- SocialMediaToday, Data Shows That X Premium Take-up Is Growing
- Metricool, X (Twitter) Engagement
- Charle, Top 26 Twitter (X) Statistics that we think you shoud should know about
- SEO.AI, How Many Users on X? Statistics & Facts
- notta.ai, 50+ X (Twitter) Statistics & Facts Need to Know
Maja is a Content Writer with Digital Marketing expertise, passionate about crafting compelling narratives. With a solid background in writing, critical analysis, and research, she excels at storytelling that drives engagement.
Leszek is the Digital Growth Manager at Feedink & Cropink, specializing in organic growth for eCommerce and SaaS companies. His background includes roles at Poland's largest accommodation portal and FT1000 companies, with his work featured in Forbes, Inc., Business Insider, Fast Company, Entrepreneur, BBC, and TechRepublic.
Related Articles


How Can Cropink Help?
Start with Cropink is easy and free
No credit card required