50+ Black Friday Statistics & Trends To Look For [2026]
With $10.8 billion in online sales and mobile driving 71% of purchases, Black Friday remains a major retail event. This article breaks down spending trends, discount rates, shopper habits, and performance compared to Cyber Monday.


![50+ Black Friday Statistics & Trends To Look For [2026]](https://honest-garden-2954e8e7e9.media.strapiapp.com/black_friday_statistics_thumbnail_95fad03134.png)
Do you think Black Friday still reigns as the biggest shopping day of the year?
If yes, you’re among the 79% who believe it’s the ultimate day for deals and savings!
With over $10.8 billion in US online sales in 2024, Black Friday remains a cornerstone of holiday shopping.
Let’s dive into the stats that shape this global shopping phenomenon!
Key Black Friday stats
- Black Friday sales in 2024 reached $10.8 billion, marking a 10.2% increase from 2023.
- 79% of consumers believe Black Friday offers better in-store deals compared to Cyber Monday.
- Mobile shopping accounted for 71% of online Black Friday sales in 2024.
- Electronics dominated discounts with up to 30% off, followed by apparel and home goods.
- 45% of consumers begin their holiday shopping on Black Friday, making it a pivotal event for retailers.
- Shoppers spent an average of $480 per person during Black Friday sales.
- 82% of Gen Z shoppers researched online before heading to stores.
General Black Friday trends
Black Friday is now recognized in more than 50 countries, with countries like Brazil, India, and South Africa showing a steady rise in participation.
26% of shoppers start hunting for deals as early as midnight on Black Friday.
More than 30% of retailers in the US began their Black Friday sales on Thanksgiving Day in 2024.
Over 45% of consumers start their holiday shopping on Black Friday, setting the tone for the season.
In 2024, 200 million shoppers participated in Black Friday, contributing to a record-breaking $240.8 billion in overall holiday sales from November to December.
Interestingly, 79% of shoppers believe Black Friday offers better in-store deals, while 74% prefer Cyber Monday for online savings.
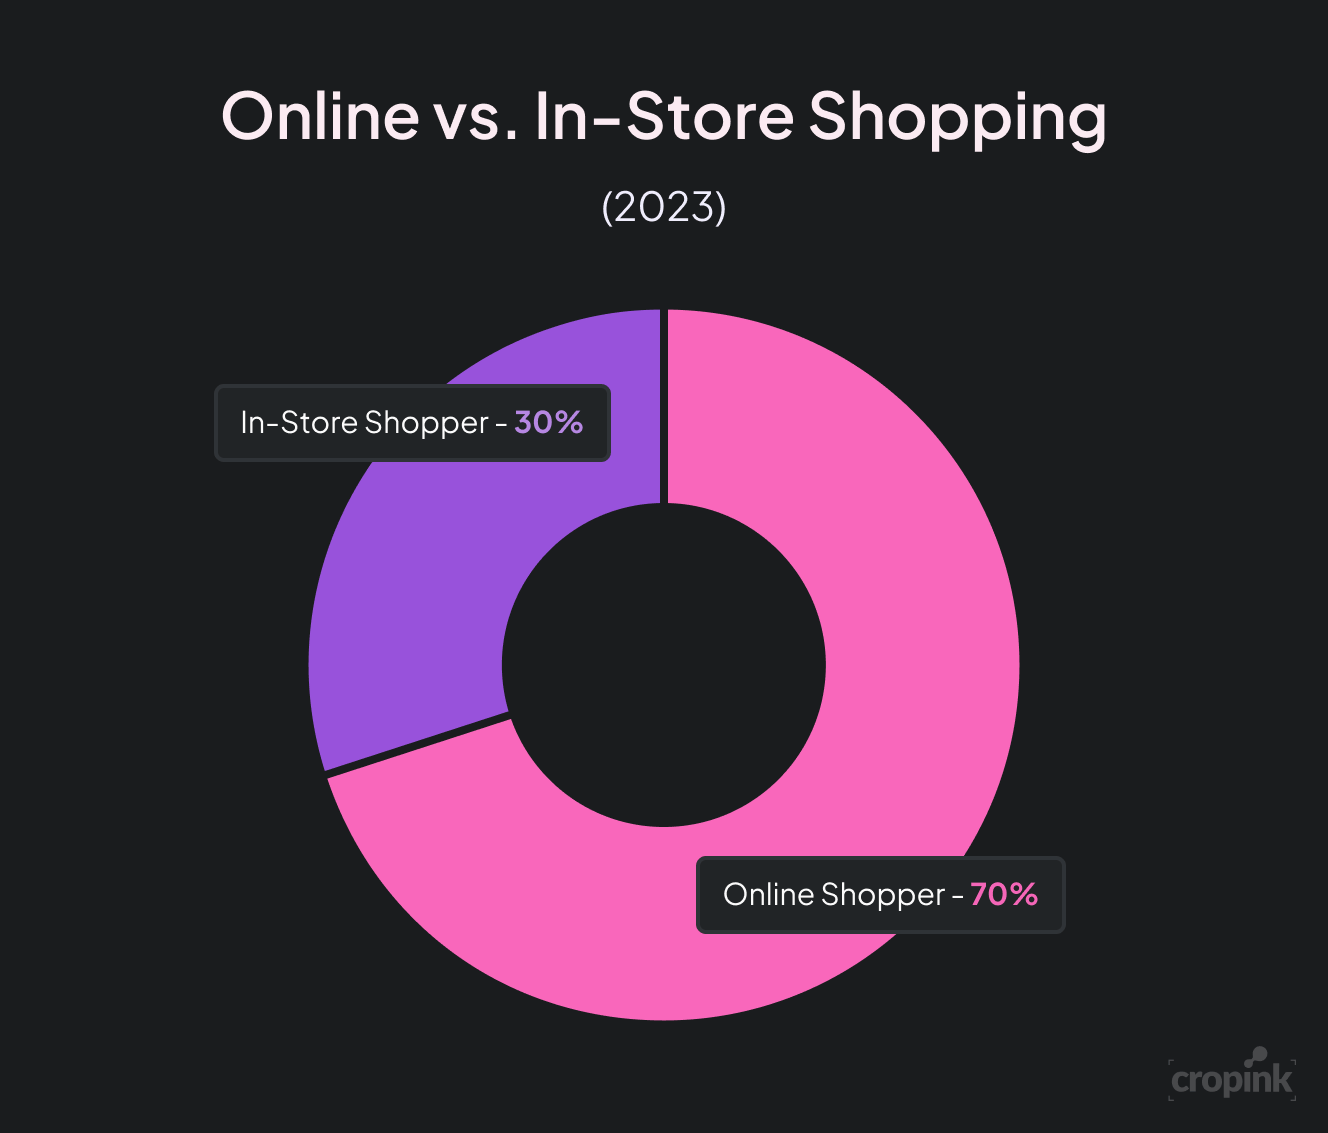
In 2023, 70% of the consumers preferred shopping online while 30% went to the stores.
A survey revealed that,
- 33% of shoppers start holiday shopping on Black Friday.
- 9% start as early as October, while 12% wait until December.
Black Friday sales statistics
As Black Friday remains a key driver of retail sales worldwide, let’s explore the numbers from recent years:
| Year | Black Friday Online Sales | % Change Per Year |
|---|---|---|
| 2024 | $10.8 billion | 10.2% |
| 2023 | $9.8 billion | 8.9% |
| 2022 | $9.0 billion | 3.4% |
| 2021 | $8.7 billion | 1.2% |
| 2020 | $8.6 billion | 21.5% |
| 2019 | $7.1 billion | 14.5% |
| 2018 | $6.2 billion | 23.3% |
| 2017 | $5.0 billion | 16.3% |
Despite e-commerce dominance, 30% of total Black Friday sales still come from physical stores.
Toys accounted for 15% of sales, with discounts starting at 20% and going up to 60% during flash sales.
In 2024, Europe reported a 9% increase in Black Friday sales, driven largely by tech deals in Germany and the UK.
Black Friday consumer behavior
Did you know 9 out of 10 shoppers actively plan their Black Friday purchases?
Here’s how they prepare:
- 82% research deals online beforehand.
- 45% use apps to compare prices.
- 35% sign up for retailer newsletters for early access.
However, 10% of shoppers express dissatisfaction due to:
- Unattractive discounts (57%)
- Limited stock (42%)
- Long queues in stores (21%)
Around 40% of shoppers abandon their carts during Black Friday, citing shipping costs as the primary deterrent.
35% of shoppers admitted to buying items not on their planned list due to aggressive discounts.
It is interesting to know that Baby Boomers are more focused on practical purchases like appliances, while Millennials and Gen Z prioritized trendy gadgets and fashion.
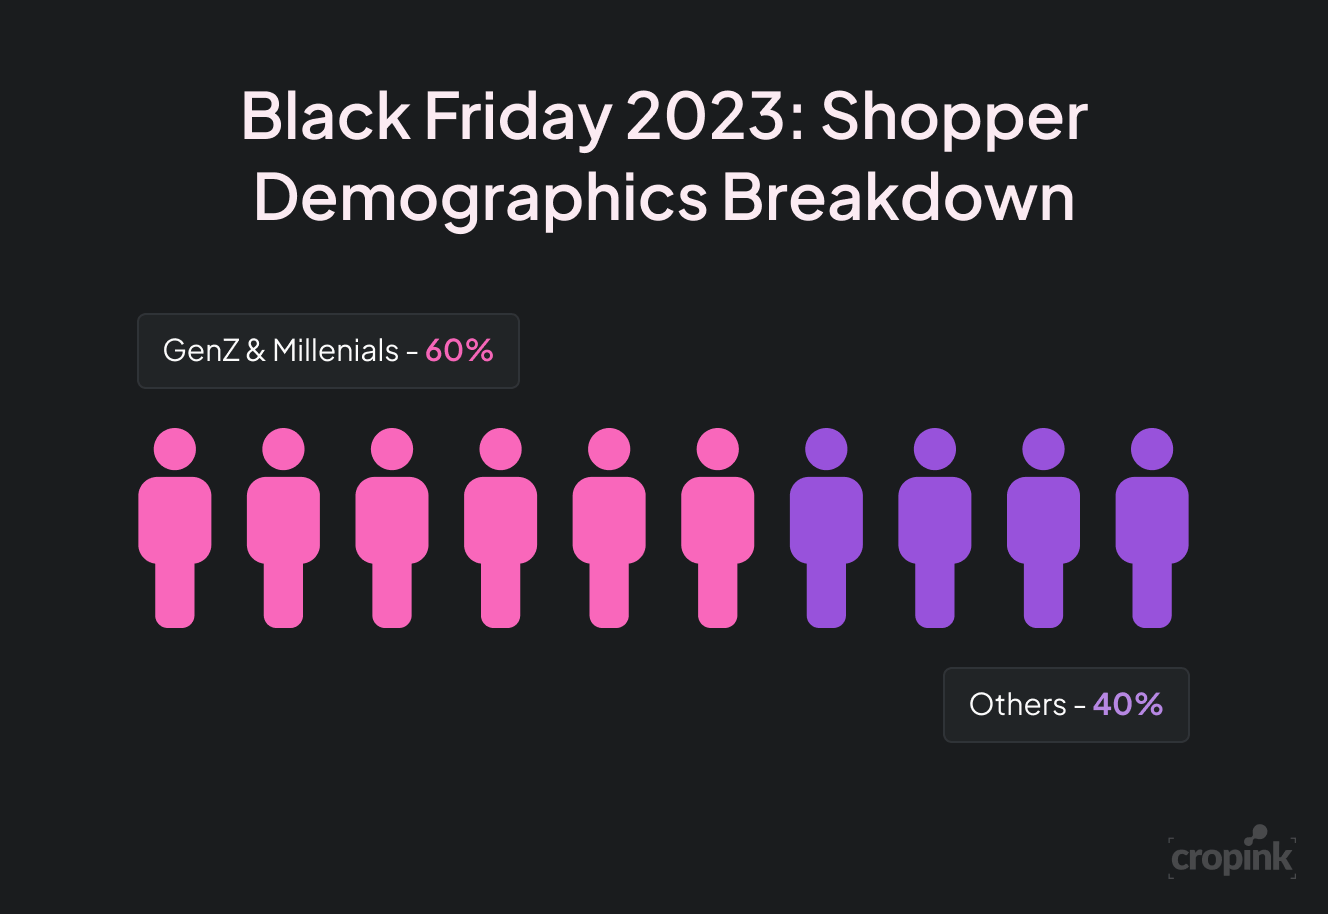
Also, 2023 Black Friday sales data suggest that Gen Z and Millenials were 60% of the total buyers.
Black Friday discount statistics
What items had the steepest discounts?
Here’s the breakdown:
| Category | Average Discount |
|---|---|
| Electronics | 30% |
| Home Appliances | 28% |
| Apparel | 25% |
| Toys | 20% |
| Furniture | 18% |
| Sporting Goods | 15% |
88% of the top 50 online retailers offered Black Friday discounts.
Amazon reported a 130% increase in ad sales on Black Friday 2024.
Black Friday sales statistics
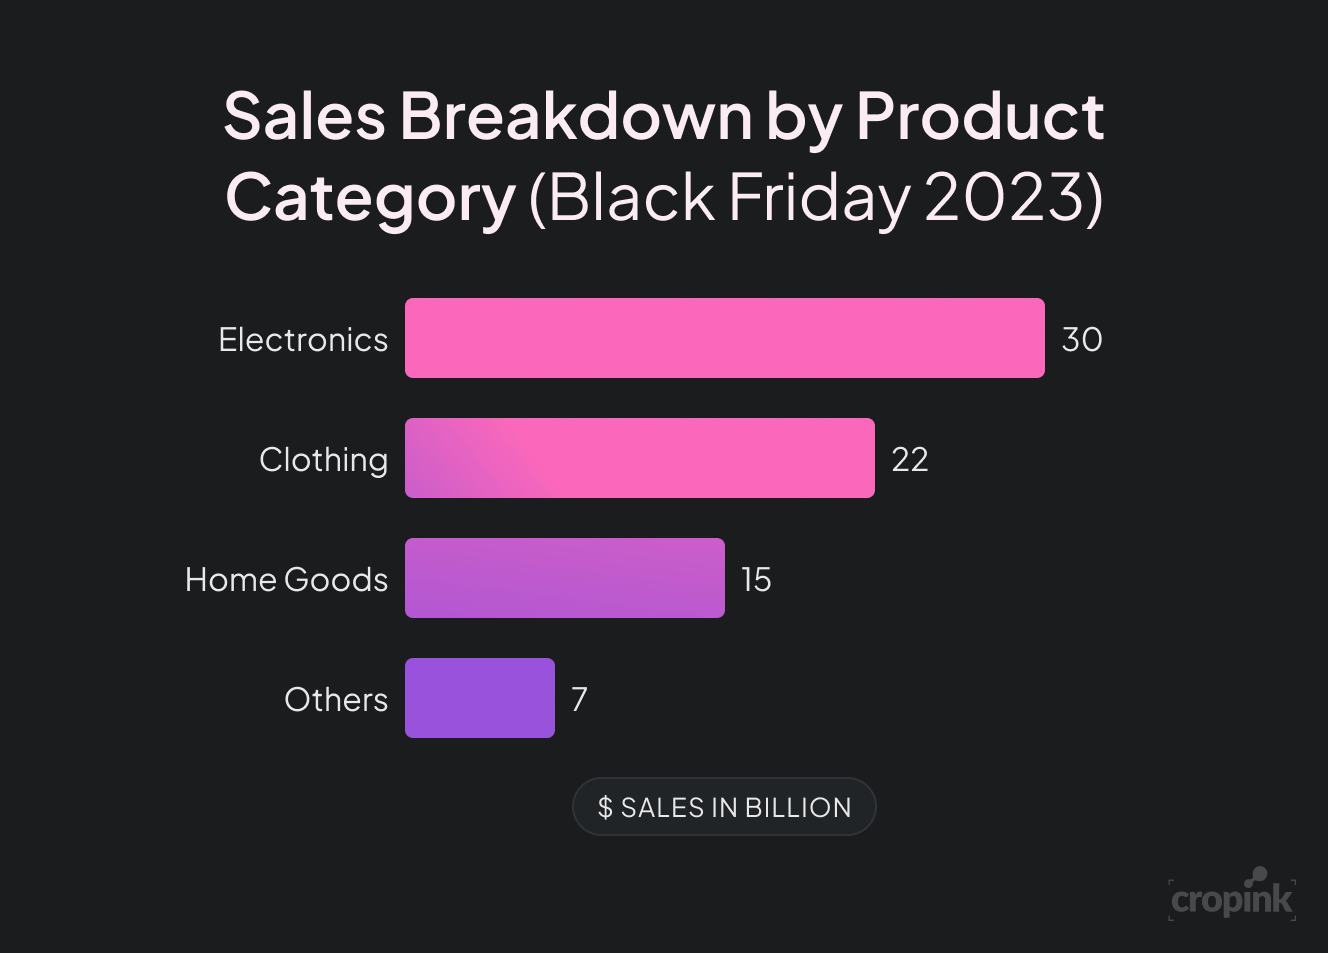
The electronics category secured first position in 2023 with $30 billion in sales.
The next big player was the Clothing industry with total sales of $22 billion in 2023 alone.
Home goods made sales of $15 billion in total.
The rest of the categories together sold $7 billion items in 2023 Black Friday sales.
Black Friday mobile statistics
Mobile shopping has become integral to Black Friday’s success:
- 71% of online sales on Black Friday in 2024 were made via mobile devices.
- However, 68% of shoppers still preferred to research deals on desktops before purchasing via mobile.
- 78% of consumers cited convenience as the main reason for using their smartphones.
- Mobile apps for major retailers saw a 35% increase in downloads during November 2024.
- Shoppers spent an average of $110 per mobile transaction.
- Over 45% of mobile purchases were completed using digital wallets like Apple Pay or Google Pay.
Black Friday vs Cyber Monday trends
While Black Friday focuses on in-store and online deals, Cyber Monday leads in digital dominance:
- Black Friday online sales- $10.8 billion (2024)
- Cyber Monday online sales- $13.3 billion (2024)
- Peak hours for Black Friday- 9 AM – 11 AM
- Peak hours for Cyber Monday- 8 PM – 10 PM
Black Friday discounts are strongest for in-store items, while Cyber Monday excels in electronics and tech deals.
While Cyber Monday outperformed Black Friday in overall online sales ($13.3 billion vs. $10.8 billion in 2024), Black Friday attracted 20% more unique visitors to retailer websites.
Some facts about Black Friday
- The term "Black Friday" was first used on September 24, 1869, by two investors, Jay Gould and James Fisk. They attempted to corner the US gold market, causing a financial panic.
- In the 1960s, retailers attempted to rebrand "Black Friday" as "Big Friday" to remove the negative connotations associated with the term, though the new name didn't gain traction.
- In 2011, Walmart began opening its stores on Thanksgiving evening, initiating a trend among retailers to start Black Friday sales earlier each year.
Curious about similar topics? Don’t miss these articles:
- Black Friday Marketing Ideas
- Creative Christmas Ads
- Black Friday Marketing Strategy
- Christmas Spending Statistics
- Cyber Monday Statistics
FAQs
Mobile shopping accounted for 71% of online sales, highlighting the growing importance of mobile-optimized retail experiences.
Electronics lead the list with 30% off, followed by apparel (25%) and home goods (20%).
The most active hours are 9 AM to 11 AM, with spending reaching $12.6 million per minute in 2024.
Both events are equally significant, but Black Friday sees higher in-store traffic, while Cyber Monday dominates online sales.
Shoppers spent an average of $480 per person during Black Friday in 2024.
Wrapping Up
Black Friday continues to redefine retail with its record-breaking sales and evolving consumer trends. From $10.8 billion in online sales to the dominance of mobile shopping, this event remains a staple of the holiday season.
Whether you’re a bargain hunter or a retailer, Black Friday’s insights offer a glimpse into the future of shopping.
Sources
- Adobe Newsroom. Holiday Statistics
- WiserNotify. Black Friday Stats
- Statista. Black Friday Worldwide Insights
- National Retail Federation. Holiday Shopping Trends
- Digital Commerce 360. Mobile Shopping Growth
- eMarketer. Black friday Trends & Statistics
- Salesforce. Record-Breaking Cyber Week: $298B in Global Digital Sales, $51B in AI-Influenced Purchases
Manisha is a Data-Driven Marketing Expert who turns numbers into narratives and ad clicks into conversions. With a passion for performance marketing and a sharp eye for analytics, she helps brands cut through the noise and maximize their impact in the digital space.
Leszek is the Digital Growth Manager at Feedink & Cropink, specializing in organic growth for eCommerce and SaaS companies. His background includes roles at Poland's largest accommodation portal and FT1000 companies, with his work featured in Forbes, Inc., Business Insider, Fast Company, Entrepreneur, BBC, and TechRepublic.
Related Articles


How Can Cropink Help?
Start with Cropink is easy and free
No credit card required